


Weekly tracking of the Italian benchmark index. Why do we do this? Check out our strategy page.
My proprietary DBBT indicator identifies misalignments between current price and expected technical levels on major indices.
Every week, we put the FTSE MIB in our crosshairs.
The hunt is on.
The FTSE MIB started the week on a bullish note with a strong acceleration on Monday, closing above 46,000 within striking distance of the January 6th high.
This high was subsequently exceeded in the following two sessions, but without a true price signal: two small bullish candles, the first gapping up, that could not be read as a genuine bullish breakout.
On Thursday, prices retraced sharply, bringing the FTSE MIB back near last week’s close, though still in positive territory.
Finally, Friday’s partial recovery showed once again that the bulls are still present.
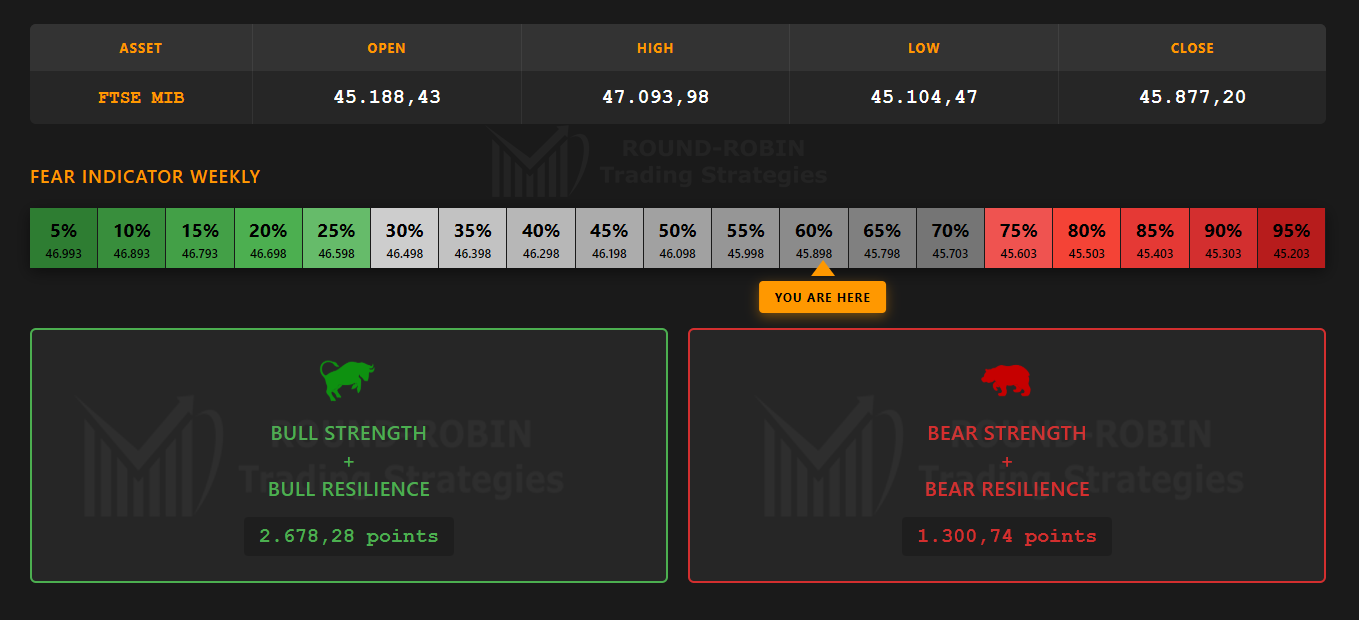
infographic: FTSE MIB Bulls vs Bears weekly
Bulls vs Bears: the week in point terms was decisively won by the bulls, but the fear indicator has moved into the attention zone.
There’s no real fear, but a 60% reading shows that from here, long positions may want to start considering hedging.
This week created one of the worst scenarios for those who bought volatility (like us): there was intraweek volatility, but it was an up and down that didn’t allow any profit from the extensions.
The FTSE MIB is at the same levels as the second week of January.
Let’s now look in detail at how to manage this delicate situation.
The Big Picture
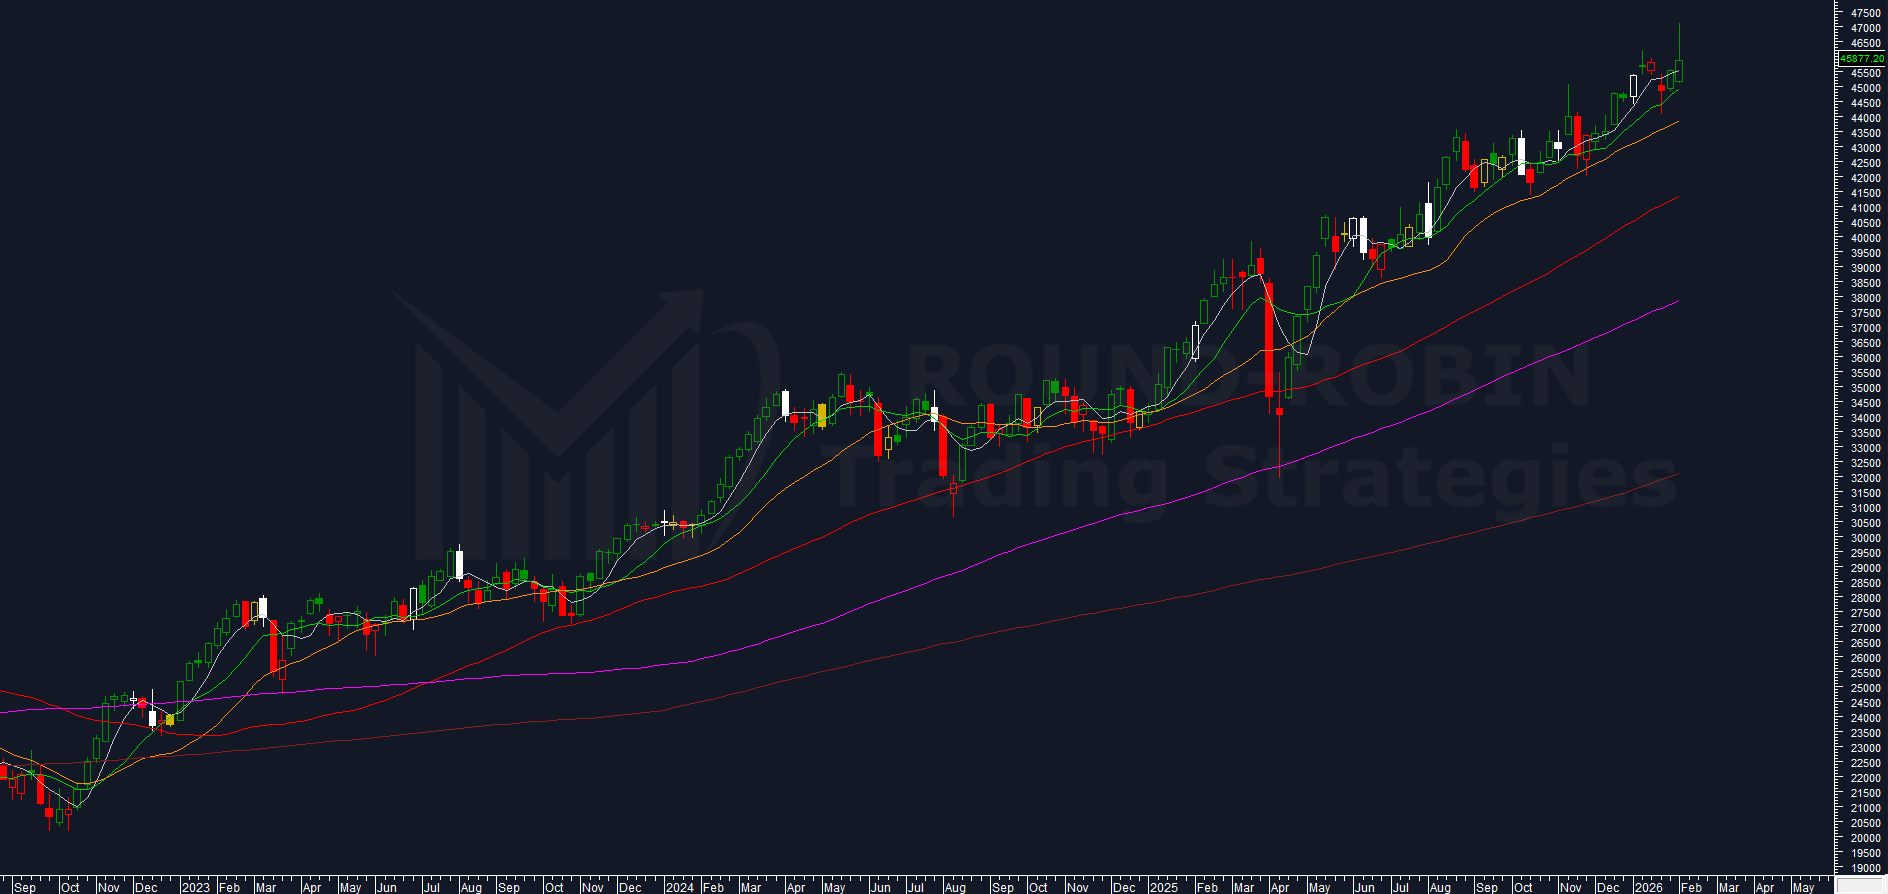
chart: FTSE MIB weekly
While everyone is screaming about Thursday’s -1.75% collapse, galvanized by what happened with silver and bitcoin, the FTSE MIB weekly chart is immaculate.
The close at 45,877.20 is above the MA5W and the moving averages are still all positively sloped, still all in exact order from fastest to slowest.
In Friday’s close, the long upper shadow that would have been present with a close at 45,800 or lower was also “cancelled”.
Let’s be clear: cancelled from the perspective of our algorithm which requires very precise parameters to be met.
The upper shadow is there, visible on the chart, but we can’t use it for decision-making… unless doing so discretionally.
The Phantom Shadow
Why are we discussing something that technically doesn’t exist according to our parameters?
Because it faded away near the close by very few points.
This isn’t a trading system, so the implications of a retracement from the 20-week high remain largely intact, provided the study is conducted without bearish bias.
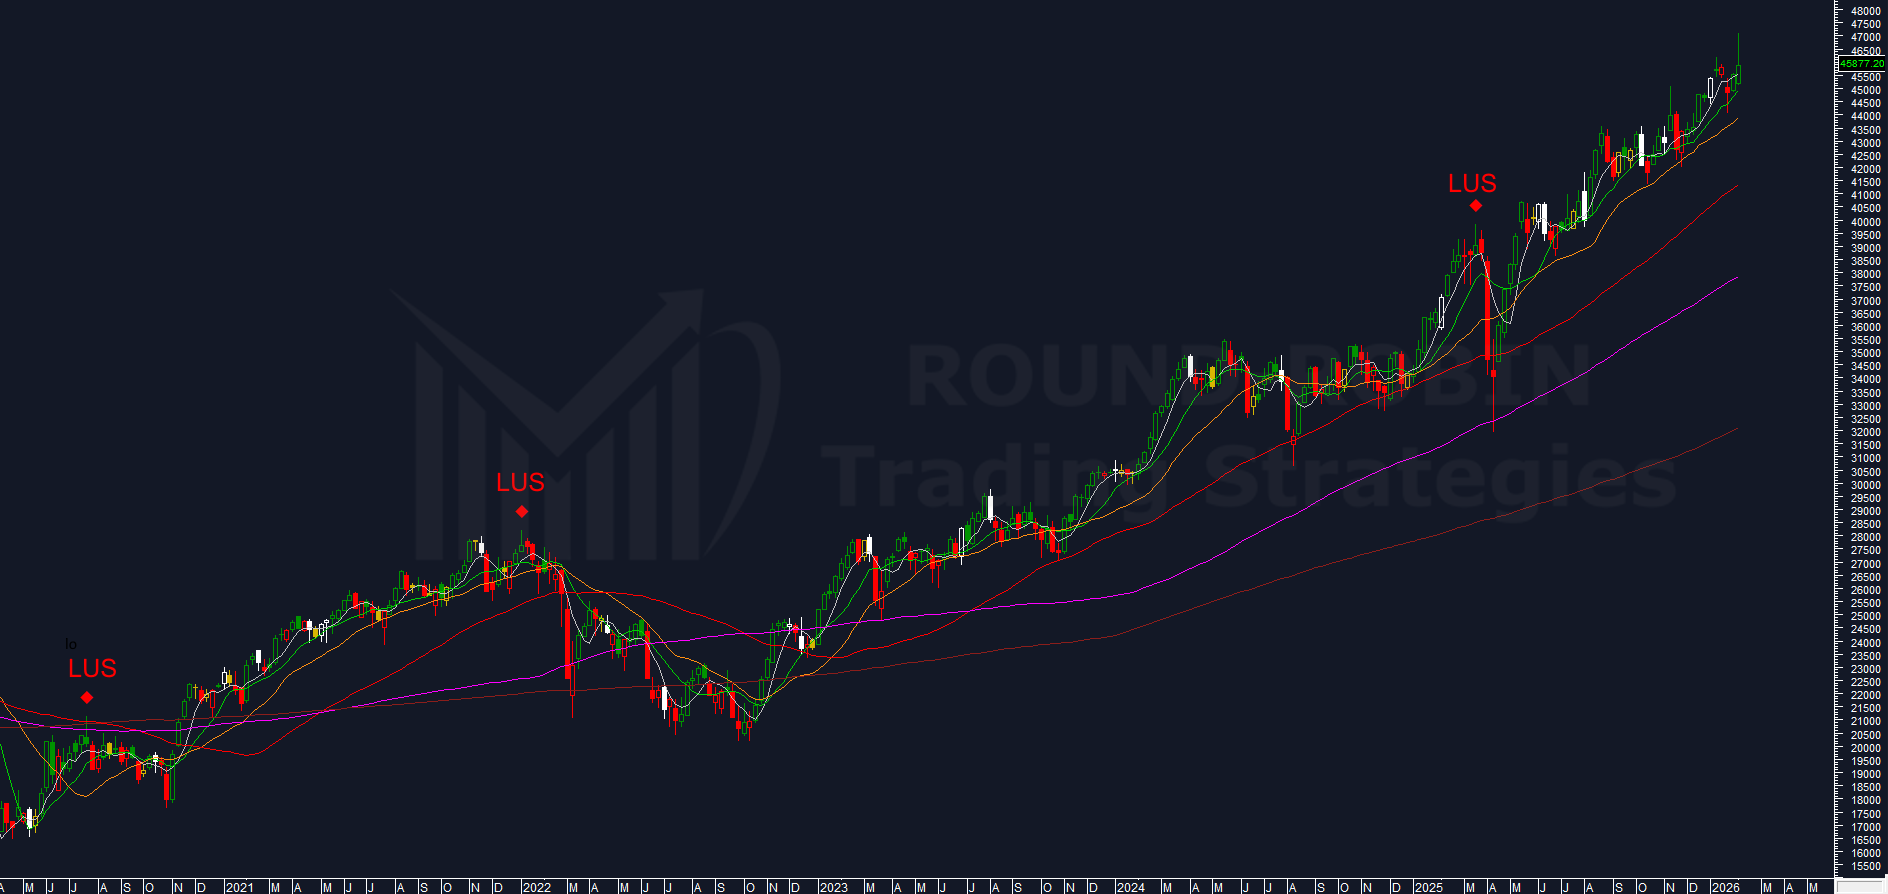
chart: FTSE MIB weekly – Long Upper Shadow
Our algo identifies the Long Upper Shadow (LUS) as a probable medium-term top, with a reasonable probability of correction down to the MA100W.
Is it always like this?
Absolutely not. Every trend has repetitive behaviors. Some patterns that worked brilliantly in the 2000 dotcom bubble didn’t work in subsequent uptrends. Every trend has its own story.
But it’s a fact: the upper shadow as the algo requires it doesn’t exist.
Let’s then widen the algo’s parameters and have it capture “second-choice” upper long shadows (LUS forced) and see what happens.
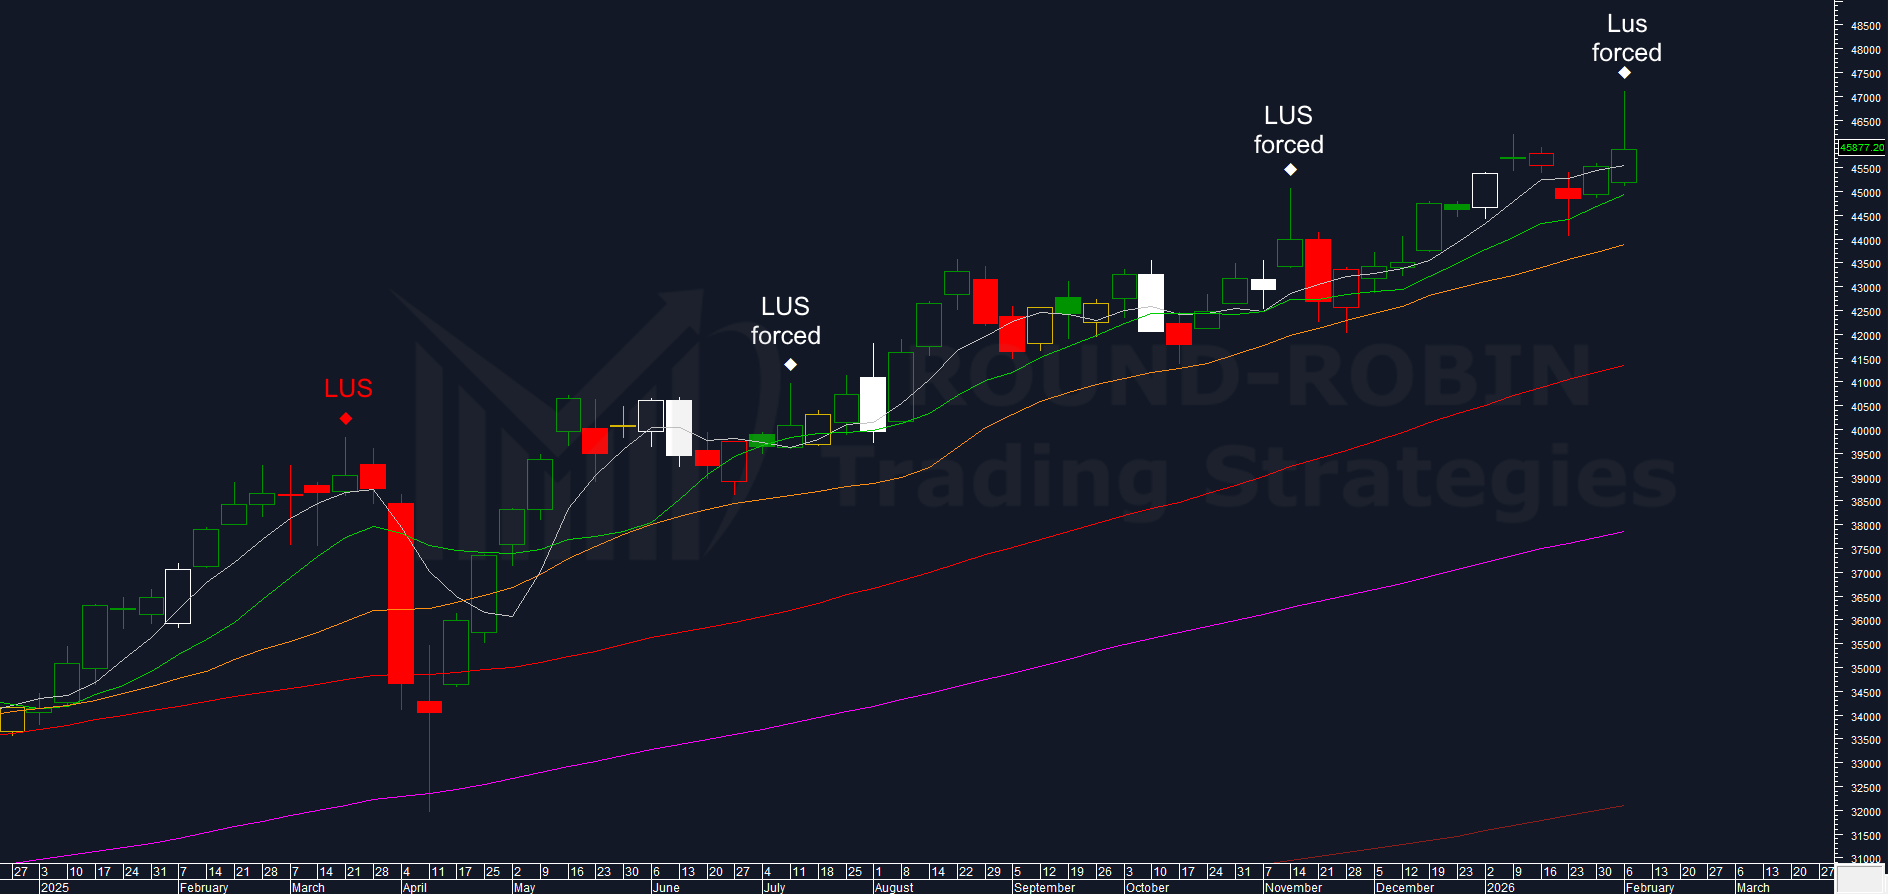
chart: FTSE MIB weekly – Long Upper Shadow + LUS Forced
There are only 2 prior cases, both recent (within 12 months), that showed different and non-extreme behaviors.
No actionable evidence.
So either we make a discretionary decision accepting what doesn’t exist, or we move on.
We move on because in 5-10 years when we look at the chart from a distance, this long upper shadow won’t be there and won’t be able to help us make sound decisions.
The Compression
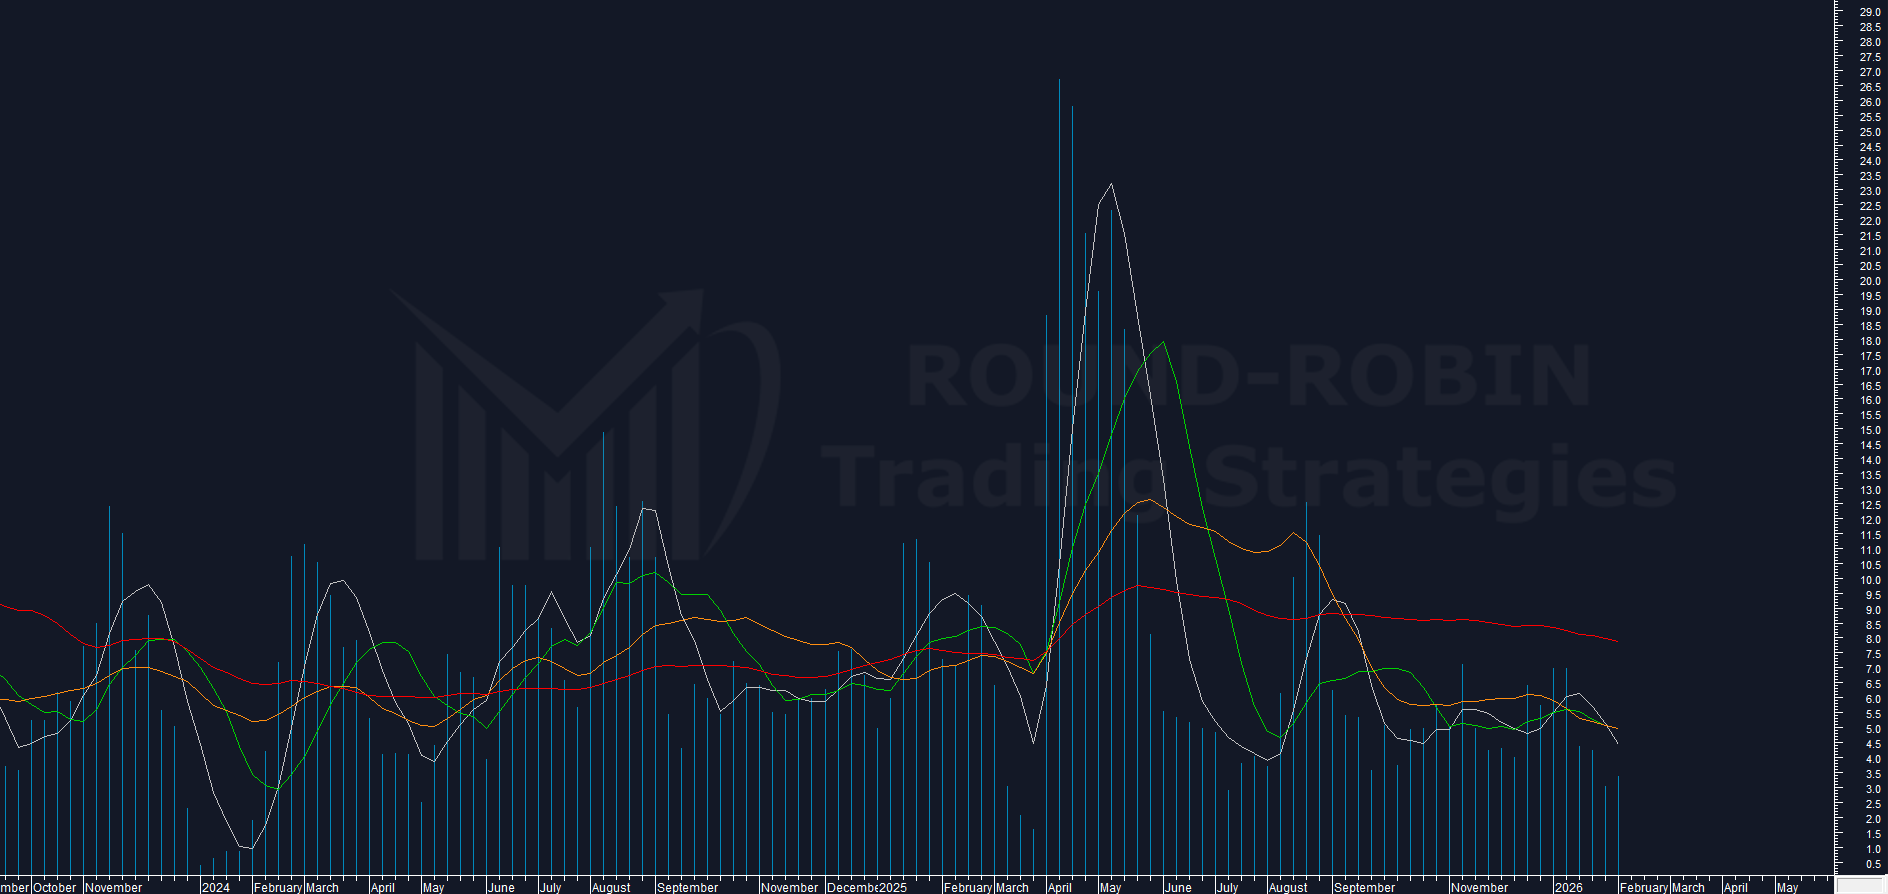
chart: FTSE MIB – proprietary volatility indicator weekly
My proprietary volatility indicator on the FTSE MIB has remained substantially stable at 3.38%.
For our position, a new drop would have been better (or less bad), which would have at least allowed us to see the fast moving averages plunge to extreme values.
So it’s telling us the same things it told us 3 weeks ago: a directional move is highly probable, but there’s no objective indication whether bull or bear.
Weekly Range %
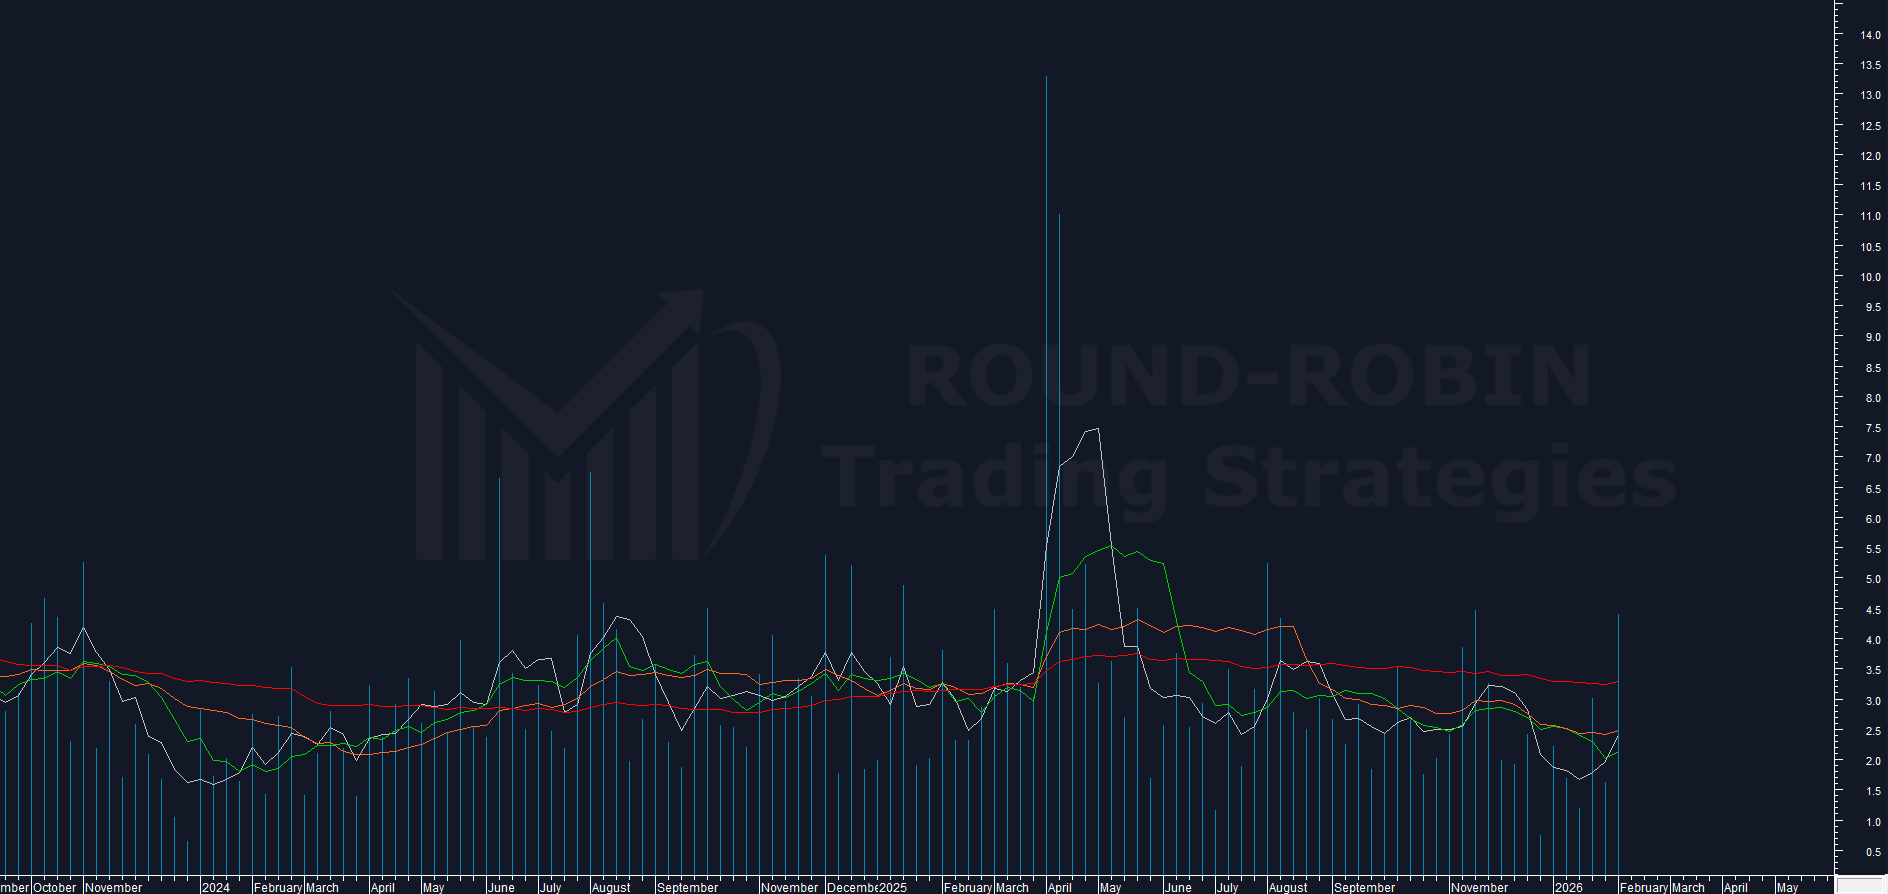
chart: FTSE MIB Range Weekly %
This was the real enemy of our strategy: a 4.41% weekly range (in the top 10 over 12 months) in a context of 3.38% volatility indicator.
In simple terms, the week overflowed beyond the indicator’s expectations but didn’t have the strength to maintain either extreme (max or min).
The result is that we’re back to square one.
Traditional and Proprietary Indicators
Traditional indicators and oscillators on the weekly chart tell us nothing.
Proprietary indicators measuring strength tell us the bull trend is intact but without momentum.
Strategy Management
Long Call OTM and Long Put OTM option strategies with a stalled market and the February 20th expiration approaching are becoming too risky.
If the market stays flat for another 2 weeks, we risk 100% loss on both legs.
For money management, there are essentially three possibilities:
1. Do nothing
PRO: volatility is still low, the market could accelerate directionally at any moment. Consistent with the study conducted.
CON: time is our enemy, options are losing value daily and there are 14 total days until expiration.
2. Close everything next Friday if there’s been no acceleration
PRO: remains consistent with the adopted strategy and goes into stop loss after patiently waiting.
CON: comes very close to gambling (the strategy reduces to hoping something happens in just 5 days).
3. Close only one of the 2 legs
PRO: significantly limits the loss on one leg.
CON: completely denatures the strategy (going from non-directional to directional).
If the first two are crystal clear and coherent, the third seems forced.
It is in fact: to adopt the third requires truly valid reasons. Are there any?
Let’s take stock of what we have:
– Phantom shadow with widened parameters doesn’t help: either use it discretionally or it doesn’t exist
– No technical configuration signaling directional movement
– No actionable traditional indicator or oscillator
– Volatility still telling us: the FTSE MIB is about to move
We have one last resource.
The Swing Trading System
We use our swing trading system solely and exclusively to manage positions in distress — a last-resort solution, but with two weeks to expiration there aren’t many alternatives.
The characteristic of this system is that it requires conflicting signals on daily and weekly timeframes, which allows us to identify situations where the market is likely to make movements in both directions on different timeframes.
What does the TS Swing MM tell us this week? Long Daily and Short Weekly. Opposite to each other on different timeframes.
But what does this actually mean?
That it’s highly probable the market will go both positive and negative by Friday’s close.
Beginner’s voice: “But this situation almost always exists!”
Very true, but in certain situations it can be exploited, and it’s easy to identify which ones:
– Positive/strongly positive opening and bull extension (without going negative)
– Negative/strongly negative opening and bear extension (without going positive)
If either of these occurs, we could consider closing one of the two legs.
It’s a last-resort move, as mentioned, because there are only 9 sessions until the February 20th technical expiration and we need to think about damage containment rather than how much profit can be realized.
The fact that a good Monday opening positive move gets completely reabsorbed during the session or the next day gives no statistical guarantee that the trend will then continue in that direction.
The TS Swing simply says: “this rise without negative territory is potentially false”.
Conclusion
Two weeks until February expiration.
A phantom shadow that would have been very useful, cancelled in the final minutes of Friday’s session.
Zero directional indications, except that on the FTSE MIB weekly chart the trend is intact.
A Long Call OTM + Long Put OTM strategy that’s eroding because time is passing and the market is immobile.
The only objective factor in our favor remains the compression evidenced by our proprietary indicator, but the divergence between weekly range % and the indicator itself raises concerns that the initial 5-week wait for a directional move could extend further.
In these cases, one must rely on strategy and/or money management.
The dilemma is: wait another week or close the leg that will appreciate at Monday’s open?
My approach when time passes and my objective is at the same distance as when I initiated the trade favors money management decisions.
What hasn’t happened in 80% of the expected timeframe is unlikely to occur in the last 20%.
Therefore, closing the Long Call side in case of an exclusively positive week opening (as the futures close would suggest) is my preferred solution.
If there’s no margin, we’ll continue with the strategy intact at least until shortly before Friday, February 13th close.
Leave a Reply