


This week’s deep dive is dedicated to the S&P 500.
We’ve been tracking this setup since W02 — and the framework still holds.
An analysis of the key technical indicators and historical patterns that guide our market reading.
S&P 500 index
The assumption is simple and strong at the same time.
If we consider this bull market as a whole — started in 2020 from the Covid bottom — we see clearly three major waves (we’re in the third now) and one smaller one (2022–23).
What links all of them?
The bull impulse ended when the S&P 500 made a bearish break of the MA20W.
Will this time be different?
It could.
But since we consider this as the same uptrend, our assumption is that history will repeat.
Same trend, same hands.
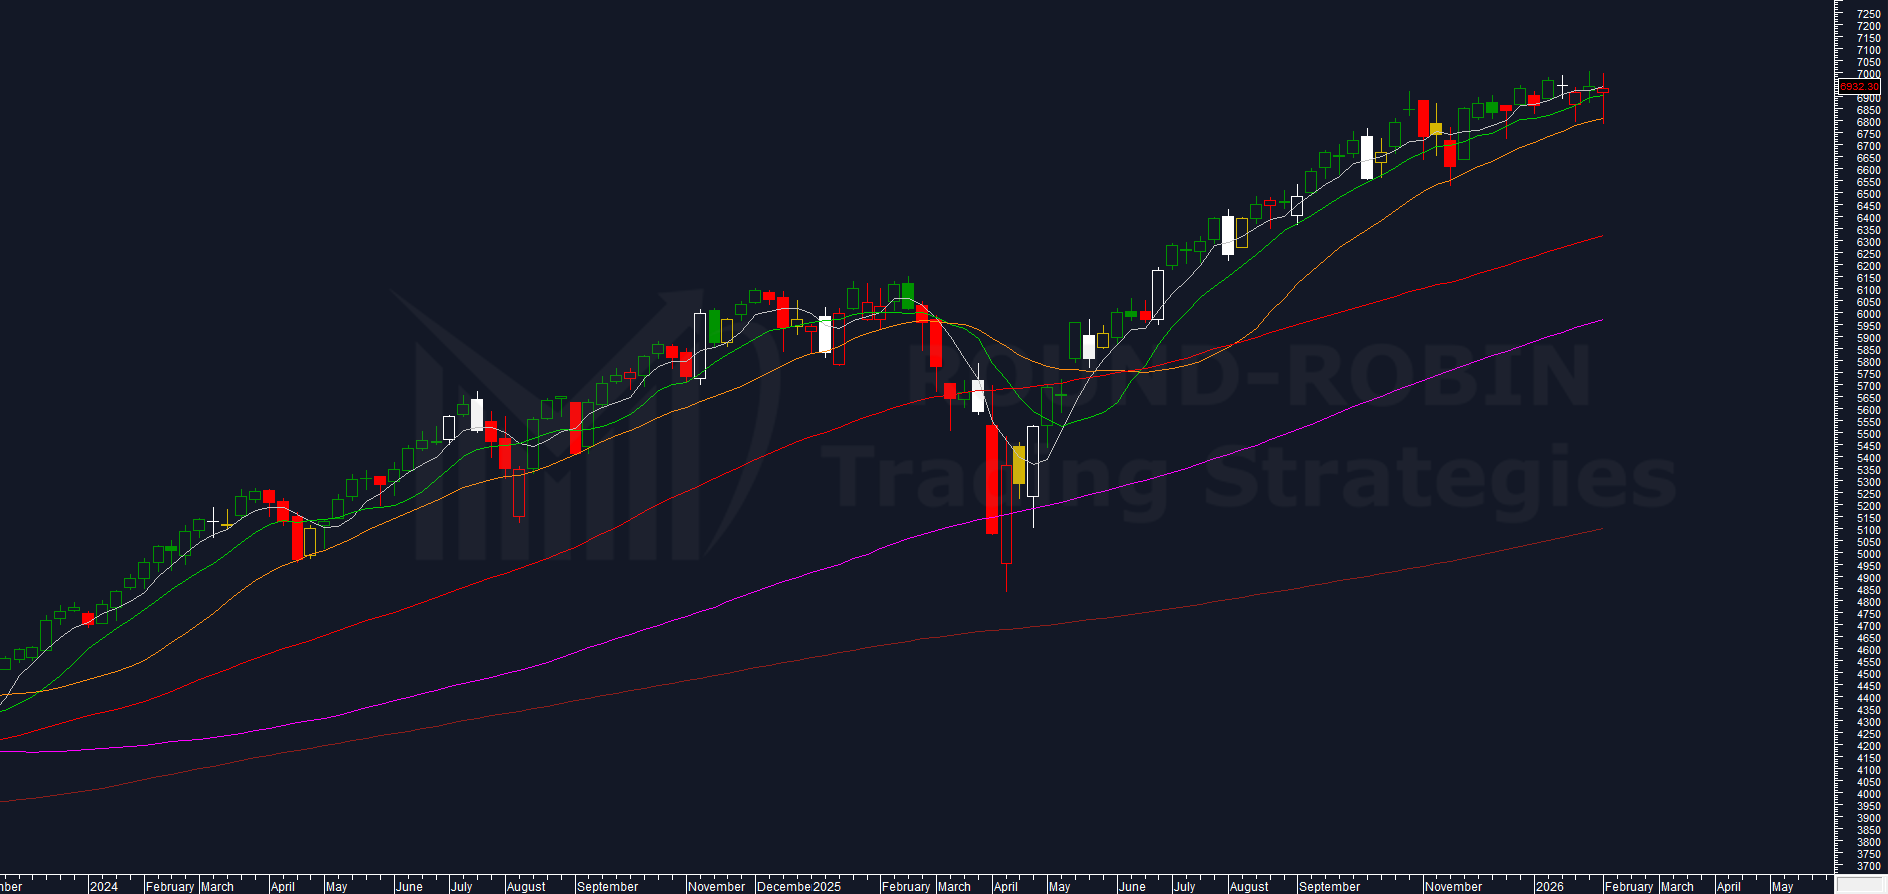
chart: S&P500 weklly
The S&P 500 weekly chart shows us two main things:
- Prices have been sitting on top for basically 15 weeks, going nowhere — not up, not down.
- The MA20W keeps reacting to each touch.
Additionally:
- The weekly candle bodies have been very small for 10 weeks straight
- All moving averages are positively inclined and in bullish order from the fastest to the slowest.
Volatility
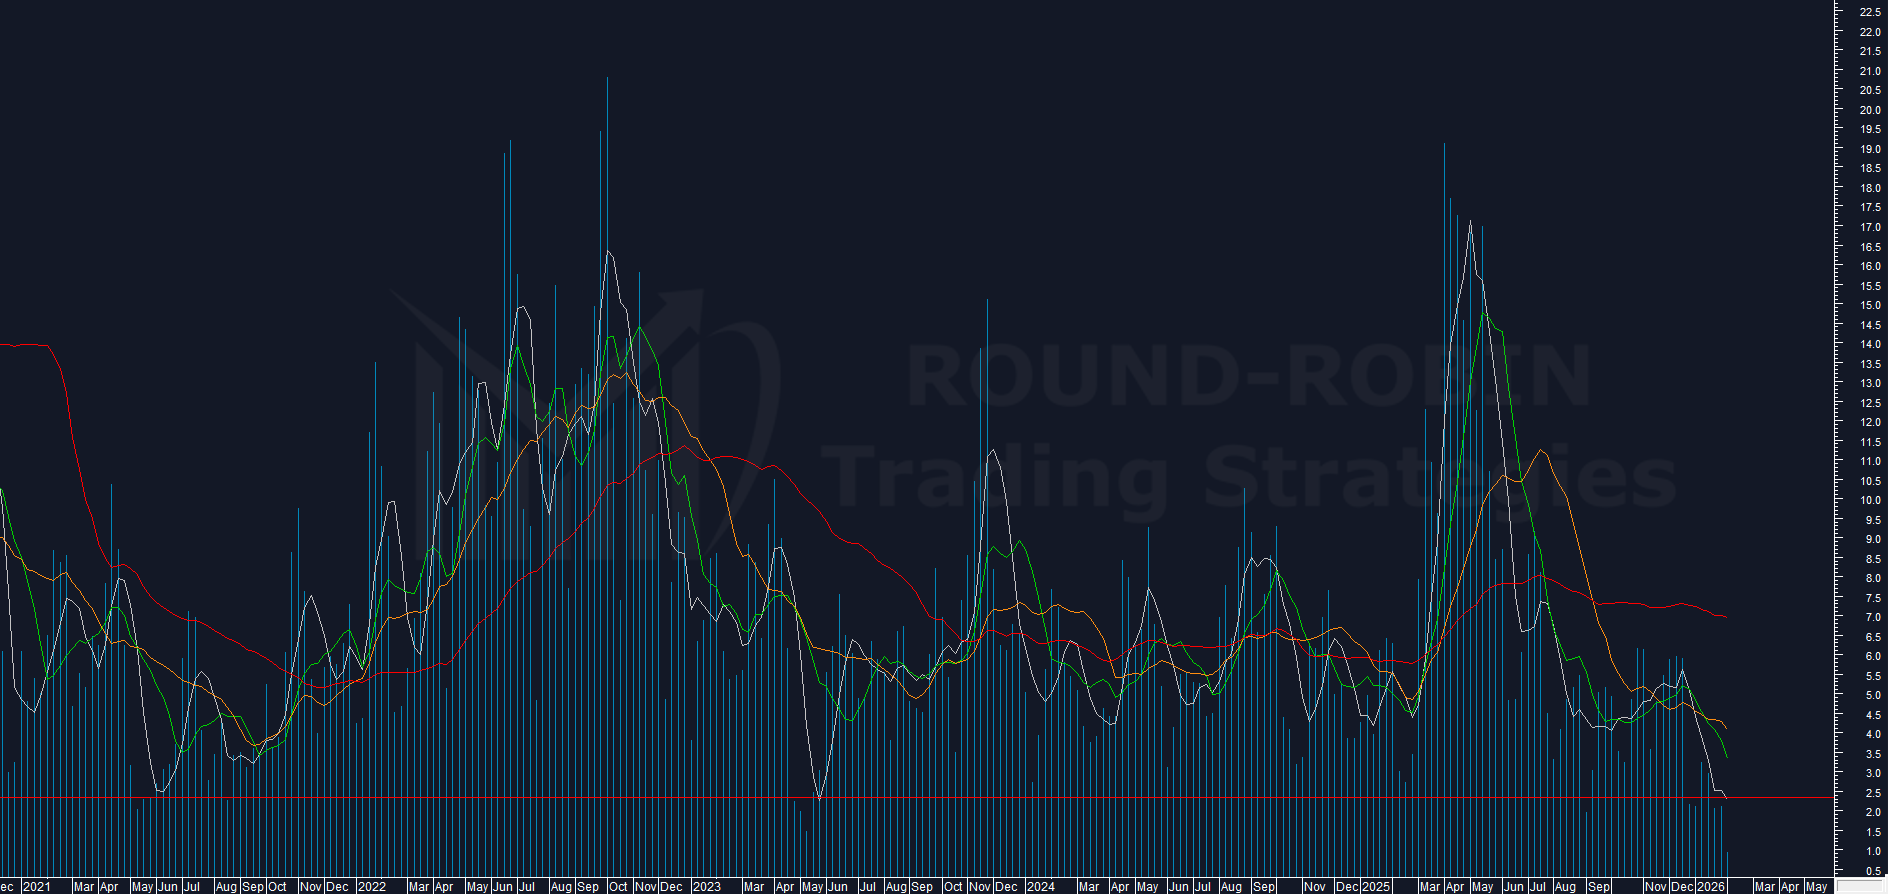
chart: S&P500 – propietary volatility indicator weekly
Our proprietary volatility indicator shows we’ve hit the limit — not a common spot.
This is the floor — the lowest volatility level the US index can sustain.
This week’s value is below 1%, and the MA5W calculated on the indicator has hit the same lows seen in June 2021 and May 2023.
Remember the assumption?
Same multi-year bull market, same hands.
So what happened in those prior cases?
Both times there was a continuation of the bull market — which eventually ended when the S&P 500 broke below the MA20W.
Here we are again.
This is not a signal. But it’s something you should be monitoring.
Historical precedents show this is not a market top — however, prices typically retrace 100% of any advance from these volatility extremes.
The other big point we noticed were the candle bodies, very small in the last 10 weeks.
Let’s put “very small” in professional terms.
Body size %
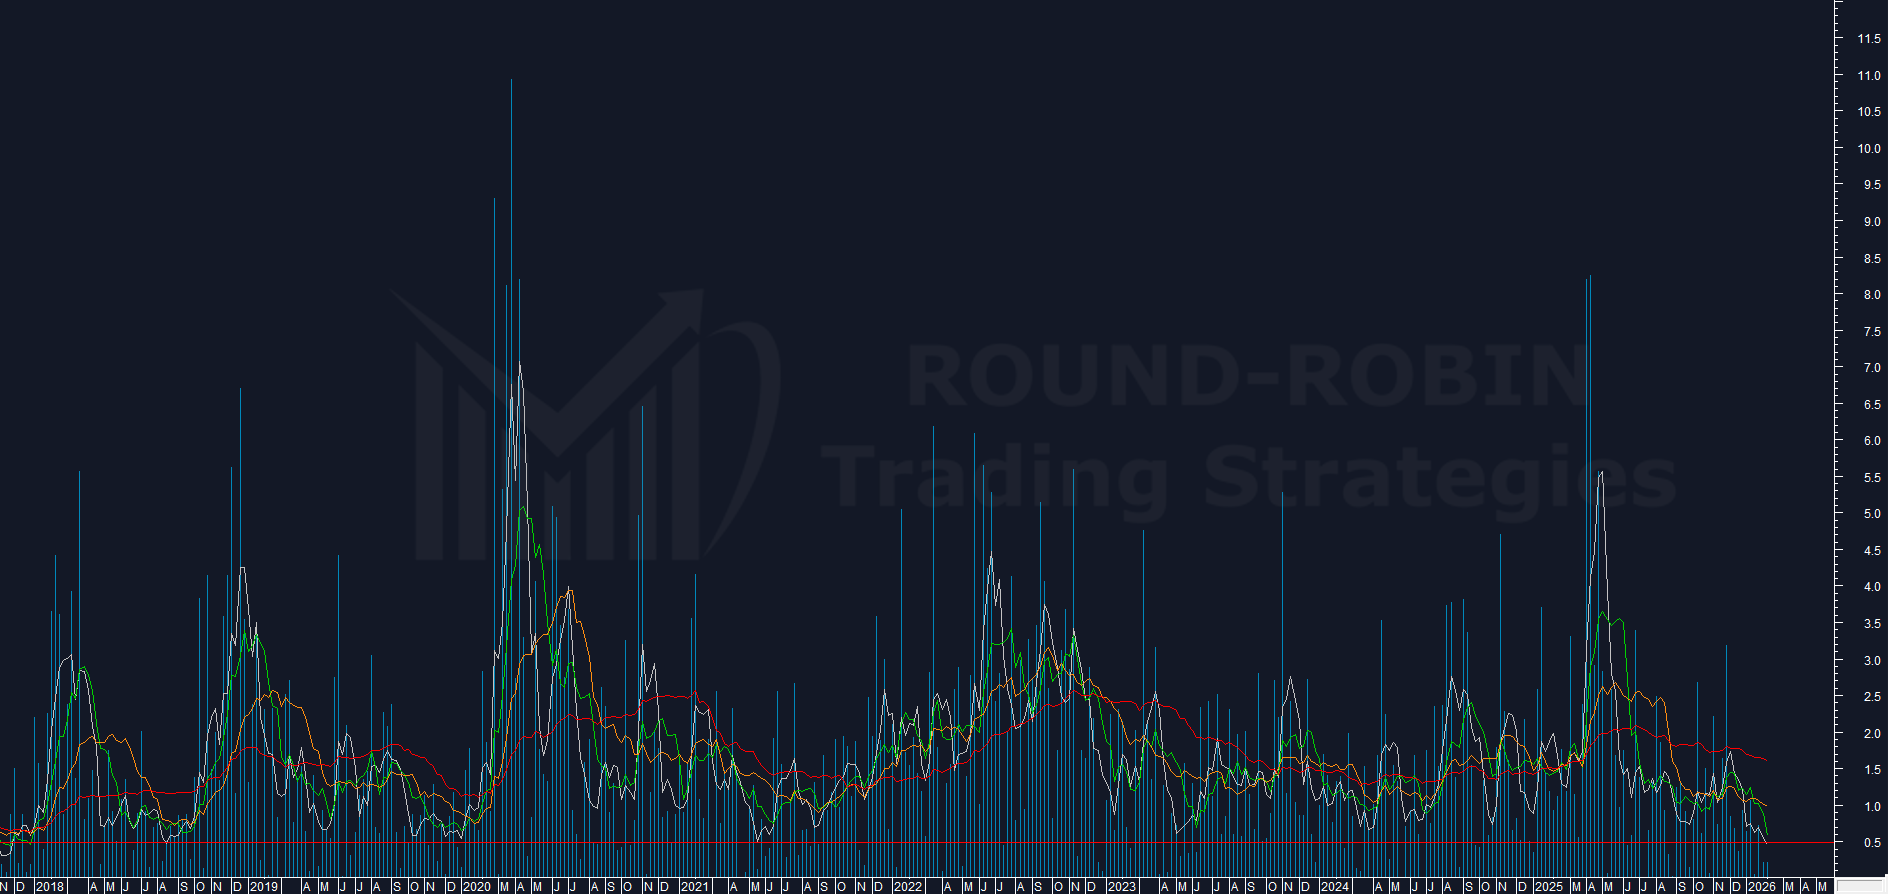
chart: S&P500 – weekly body size in %
The candle body size expressed in percentage shows another interesting analogy: since 2018, every single case in which the MA5 calculated on bodies touched the current level (~0.5%), the market rose — even at the end of 2019, just before the Covid crash.
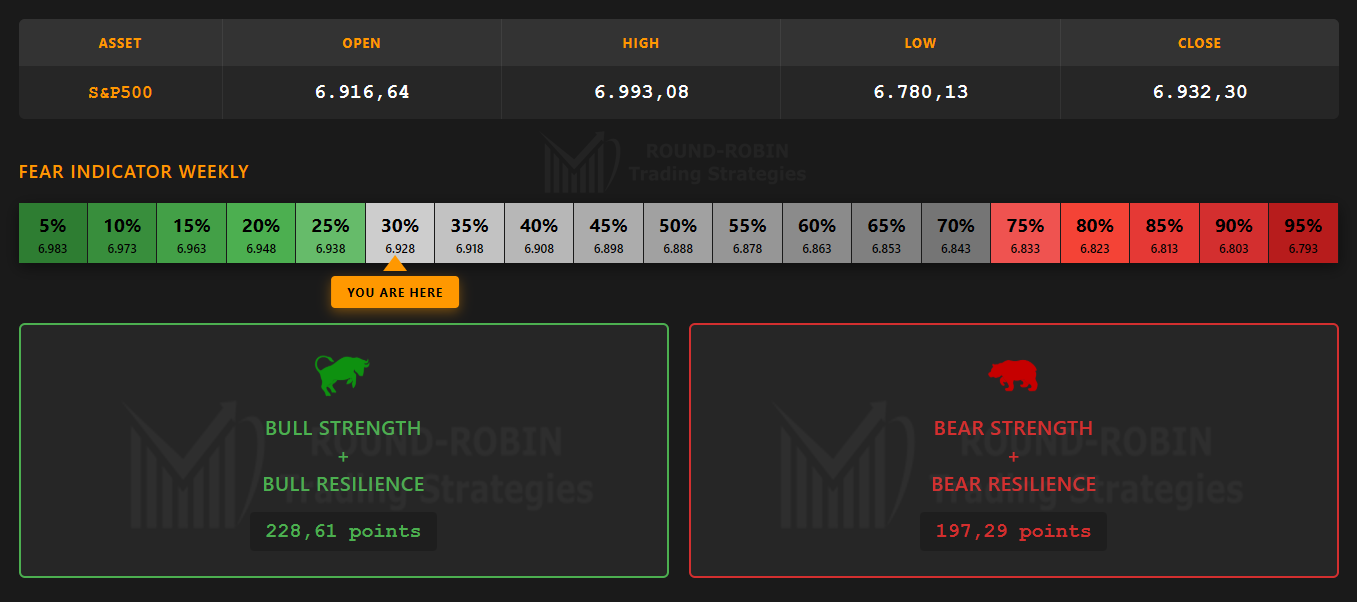
infographic: S&P500 – Bulls vs Bears weekly
This week’s data shows a slight bull victory and almost no concern for potential downside. The fear indicator stands at 30%.
Overextension on MA200W
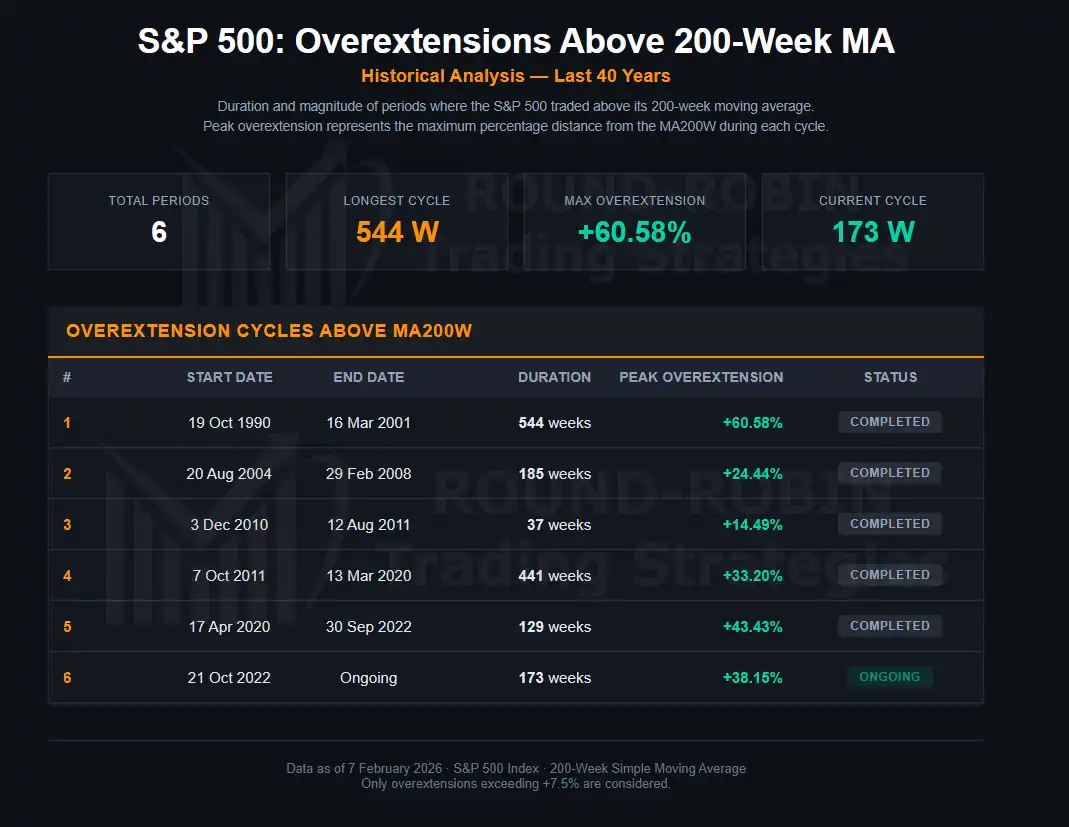
Obviously the overextension on the MA200W continues as well, which has now reached 173 weeks.
In terms of duration: the current cycle still has room. The longest cycle lasted a decade (544 weeks), the pre-COVID one 441 weeks.
In terms of magnitude: here the story is different. The current +38.15% is already the second highest level ever recorded, surpassed only by the 2000 peak (+60.58%). We also said it’s difficult to maintain these levels and even harder to extend them — indeed, we’re now at 32.93%.
The key reading: this doesn’t mean the market will fall. Overextension can also be reabsorbed if prices stabilize for a long time — a crash isn’t necessary for the gap to close. But it does mean we probably won’t see spectacular upside breakouts.
This is entirely consistent with what the other indicators are showing us.
Conclusion
The market is bull.
There’s a good chance the S&P 500 will rise further in the coming weeks.
There’s also a good chance that every gain from here will be given back in the short-to-medium term.
That’s what this bull market has taught us so far.
Our point is always the same: eyes on the MA20W.
If you’re bull, you probably want to take some cover.
If you’re bear… wait for your pitch.
The MA20W.
This is the last S&P 500 article accessible to everyone.
Soon only members will access this content.
Leave a Reply