


Quick observations on charts that caught our attention this week.
This week’s flash is a follow-up to last week’s Bitcoin analysis. The parallel with 2022 wasn’t just a parallel — it played out.
This isn’t meant to be a full analysis — just food for thought on a few charts that caught my attention this week.
⚡ BITCOIN
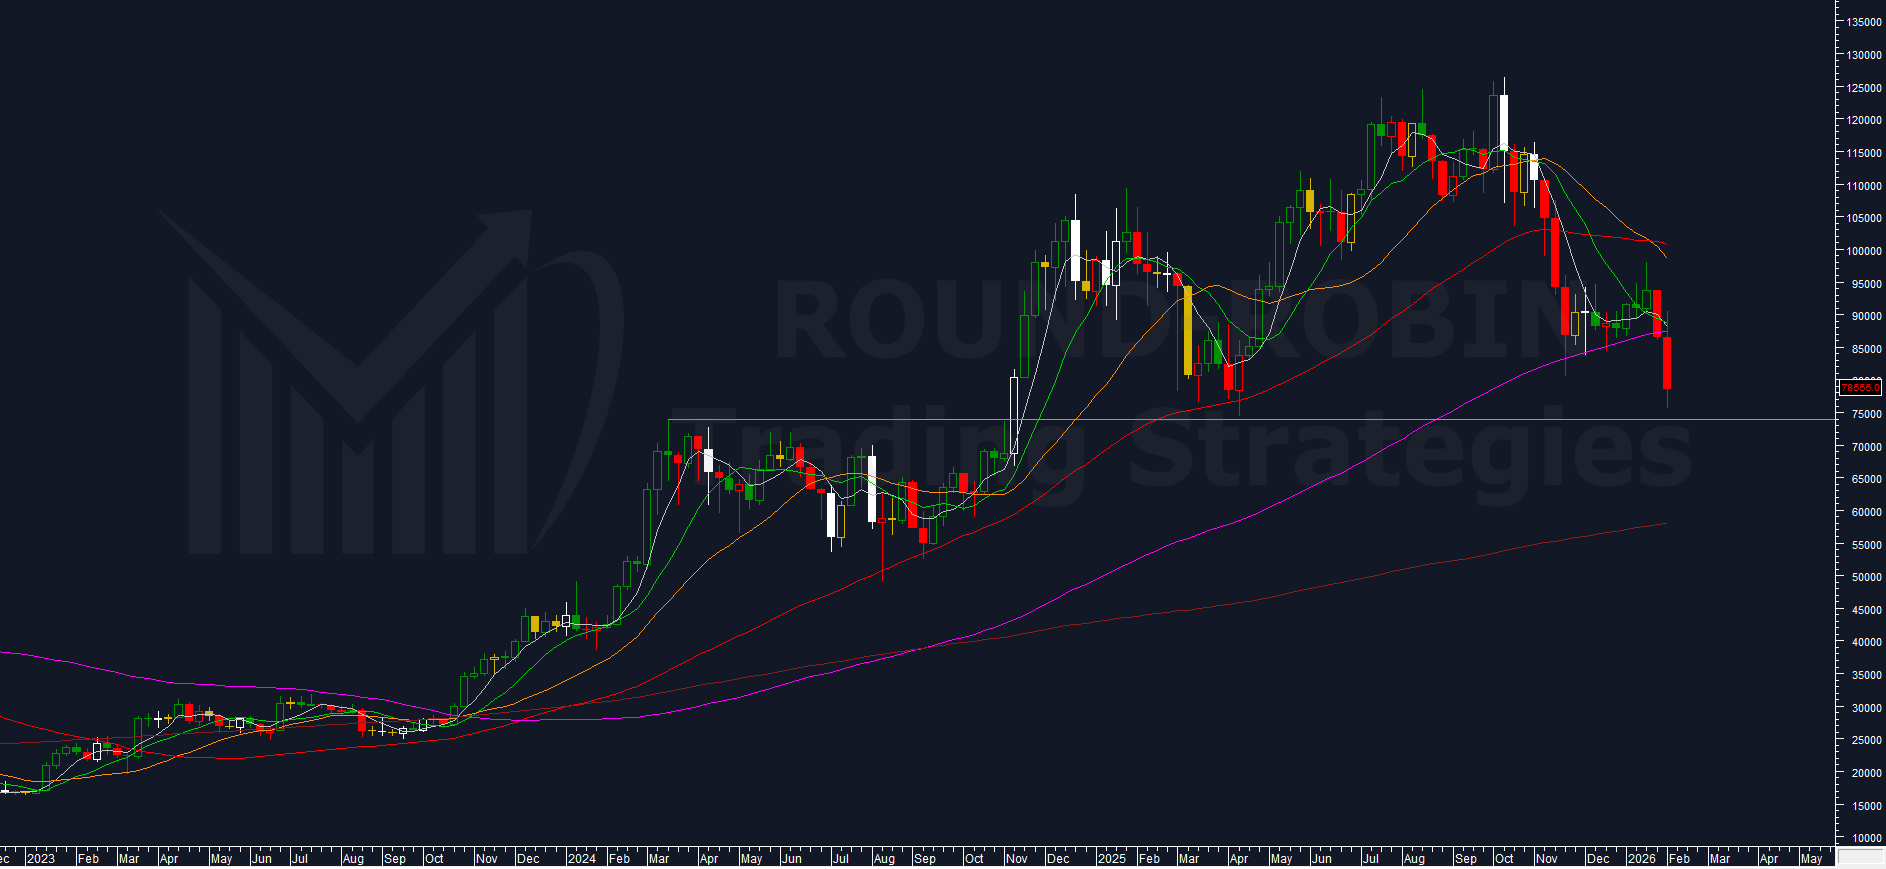
chart: Bitcoin (BTC) weekly chart
If you read last week’s edition, you know what I was watching: the MA100W (purple), and the $89,000 level that K33 Research (cited by Bloomberg) identified as the average cost basis for US spot Bitcoin ETF holders.
The setup was a textbook repeat of early 2022 — break of the MA50W, hold at the MA100W, lingering for weeks.
I said if the MA100W gave way, bears would jump on the bulls’ backs, and that breaking $89,000 could trigger panic selling.
Both things happened.
The MA100W broke.
Price crashed through $89,000 and the ETF outflows confirmed it — largest daily net outflow since November. The capitulation among spot ETF holders was real.
So where does Bitcoin go from here? On the weekly chart, the next meaningful level is around $74,000. That’s where the March 2024 high and the April 2024 low converge — a structural level, not a round number.
The oscillators on the weekly are not oversold. This matters.
It means the breakdown has room, and any hold at $74,000 could last for a while — but it wouldn’t necessarily be a reversal. It would be a pause.
Because the real call is further down. In 2022, once the MA100W broke, price didn’t stop until it found the MA200W.
Ours is now around $58,000. It’s far. It looks extreme right now. But the structure says it’s there, and if $74,000 gives way, that’s where this market is headed.
Soon only members will access this content. Subscribe free.
Leave a Reply