


It doesn’t happen very often — a -31% day on an asset as well known as Silver. Not over a week. Not over several sessions. One day. A few hours.
This article retraces what we identified, what we proposed, and what actually happened. Not to celebrate being right. To understand the mechanics of what just occurred — and what comes next.
Chart of the Week — Week 3 2026
If you need to know what to do right now, skip to the Conclusion.
Short version: don’t touch Silver. In any direction. The rest of this article is the explanation.
What We Identified (Week of January 16)
The Duration Anomaly
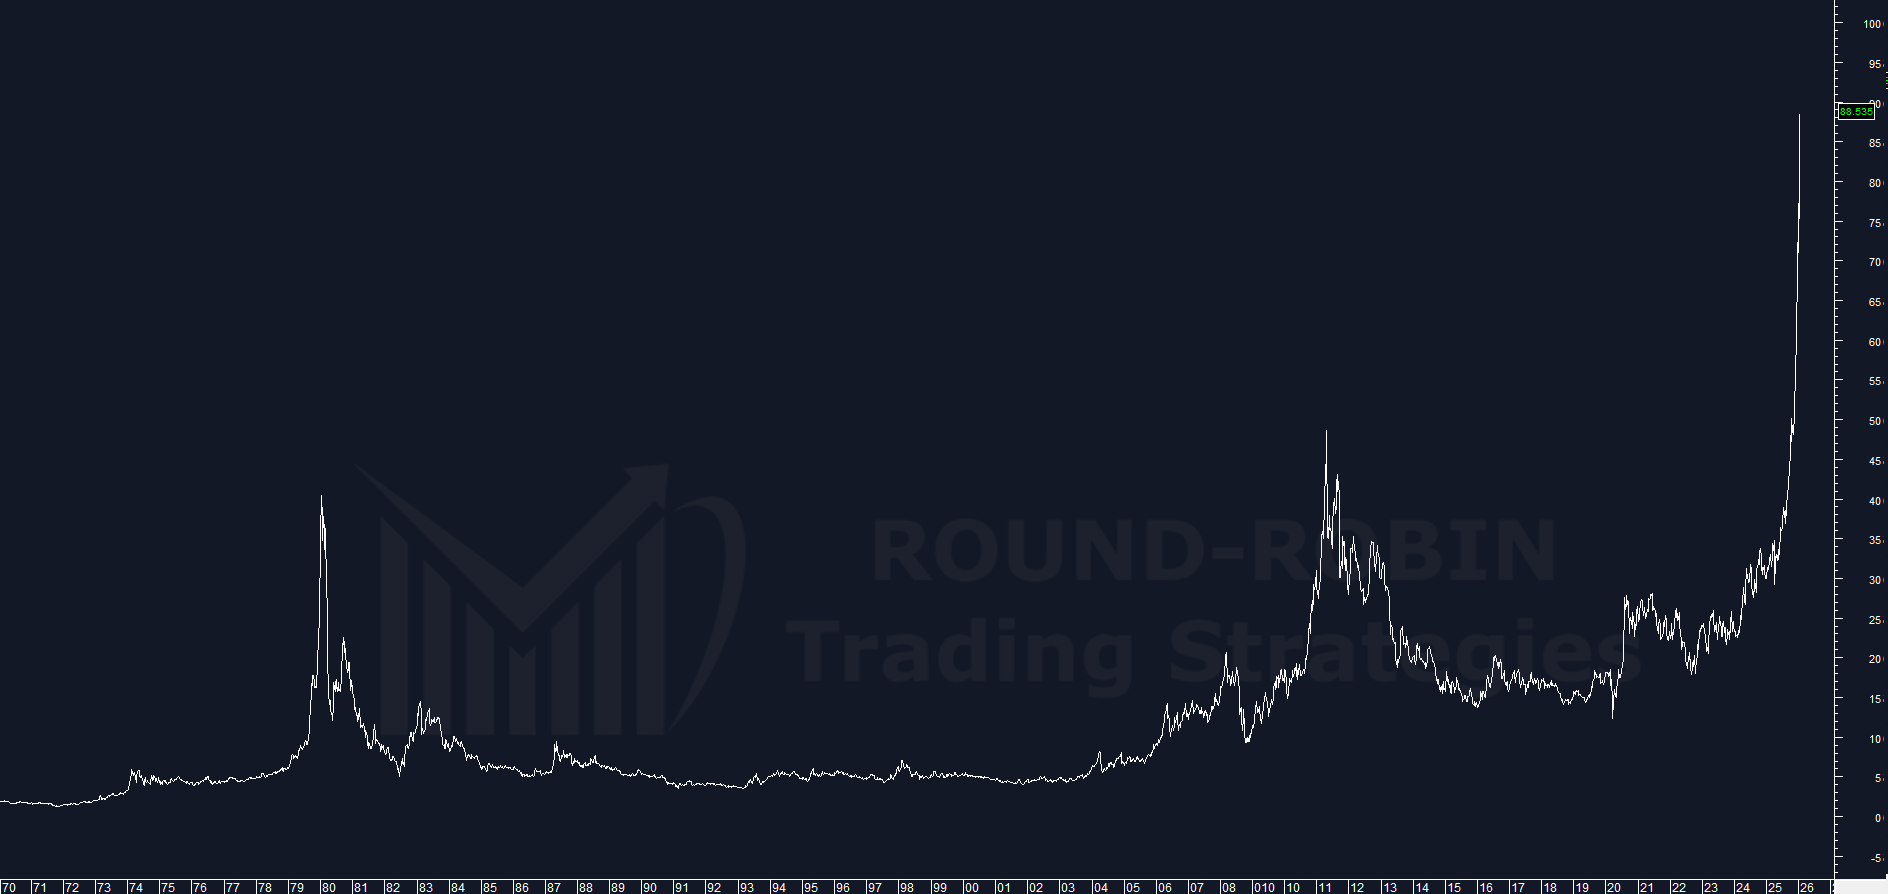
chart: Silver eod chart 1970-2026 (Jan 16)
Three epic rallies in Silver’s modern history. Rounding the numbers:
1979-80: $6 → $40 = 6-7x in 12 months
2008-2011: $9 → $49 = 5x in 28 months
2022-2026: $20 → $89 = 4x in 36 months
The current rally hadn’t yet matched the magnitude of 1979-80 (that would have meant $120+). In the end, it did. This very week.
But the duration was a record. That was the anomaly. That was the first signal.
And in all three cases, the rally was completely reabsorbed.
The Excesses
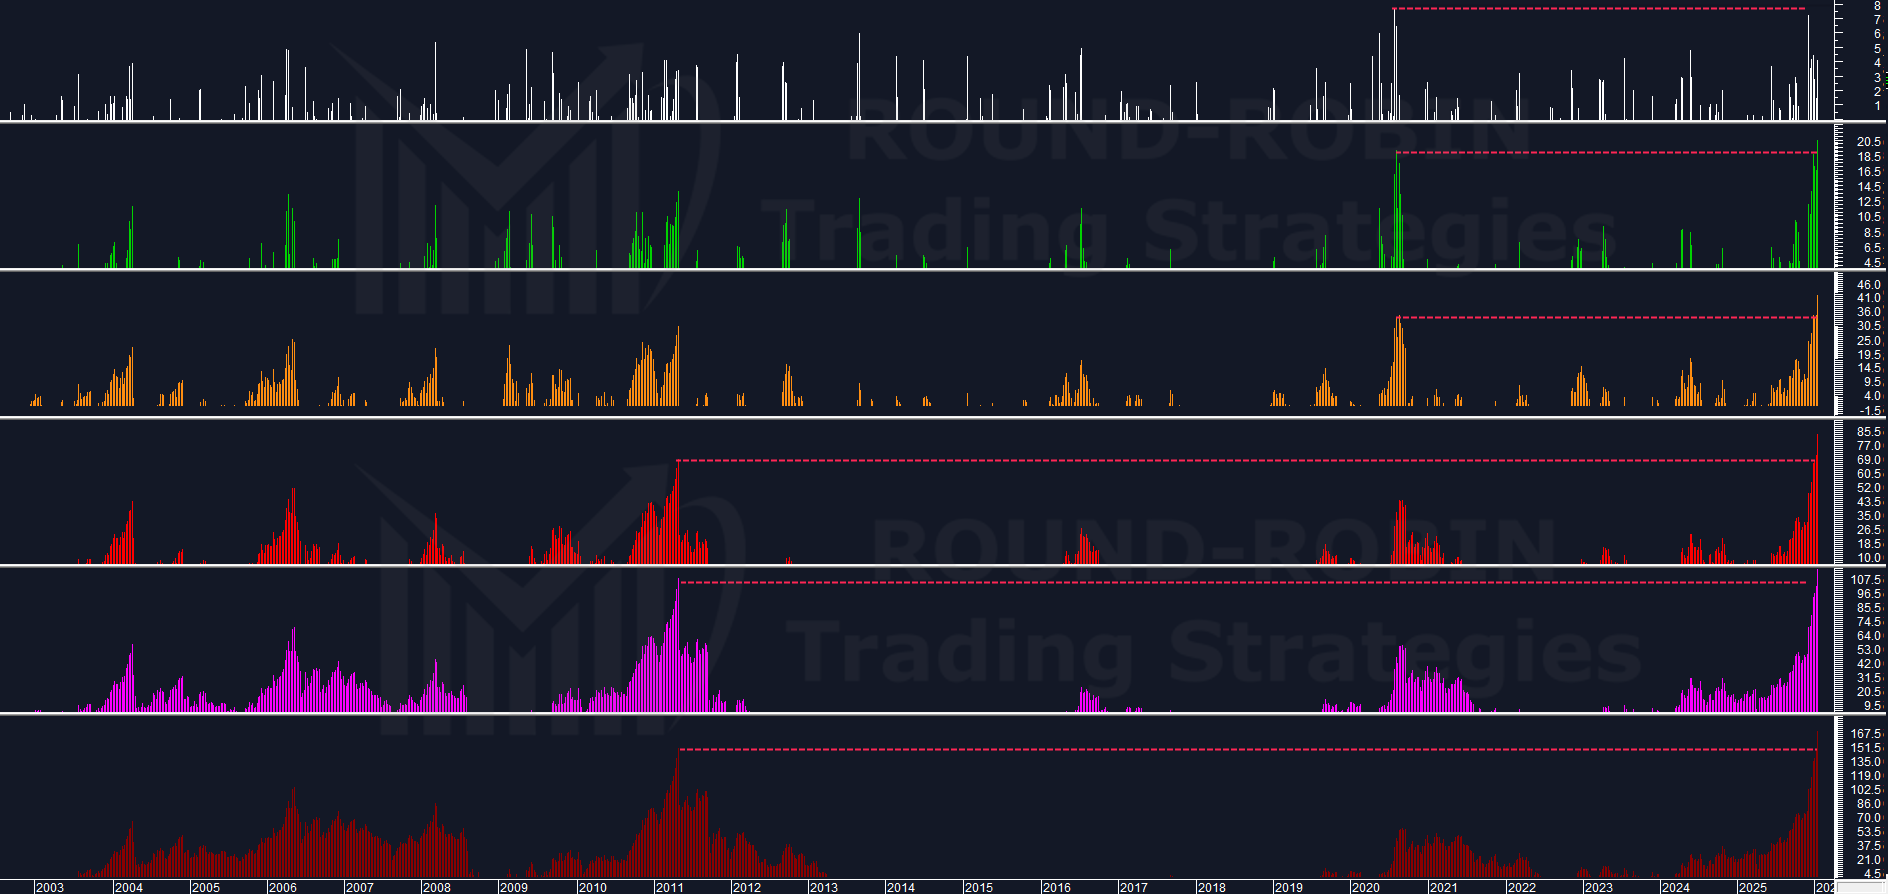
chart: Silver Moving Averages Overextensions (Jan 16)
Fast MAs (5W, 10W, 20W): overextensions exceeded the COVID rally maximums. The move was not only extended — it was too rapid.
Slow MAs (50W, 100W, 200W): overextensions reached and exceeded 2011 levels.
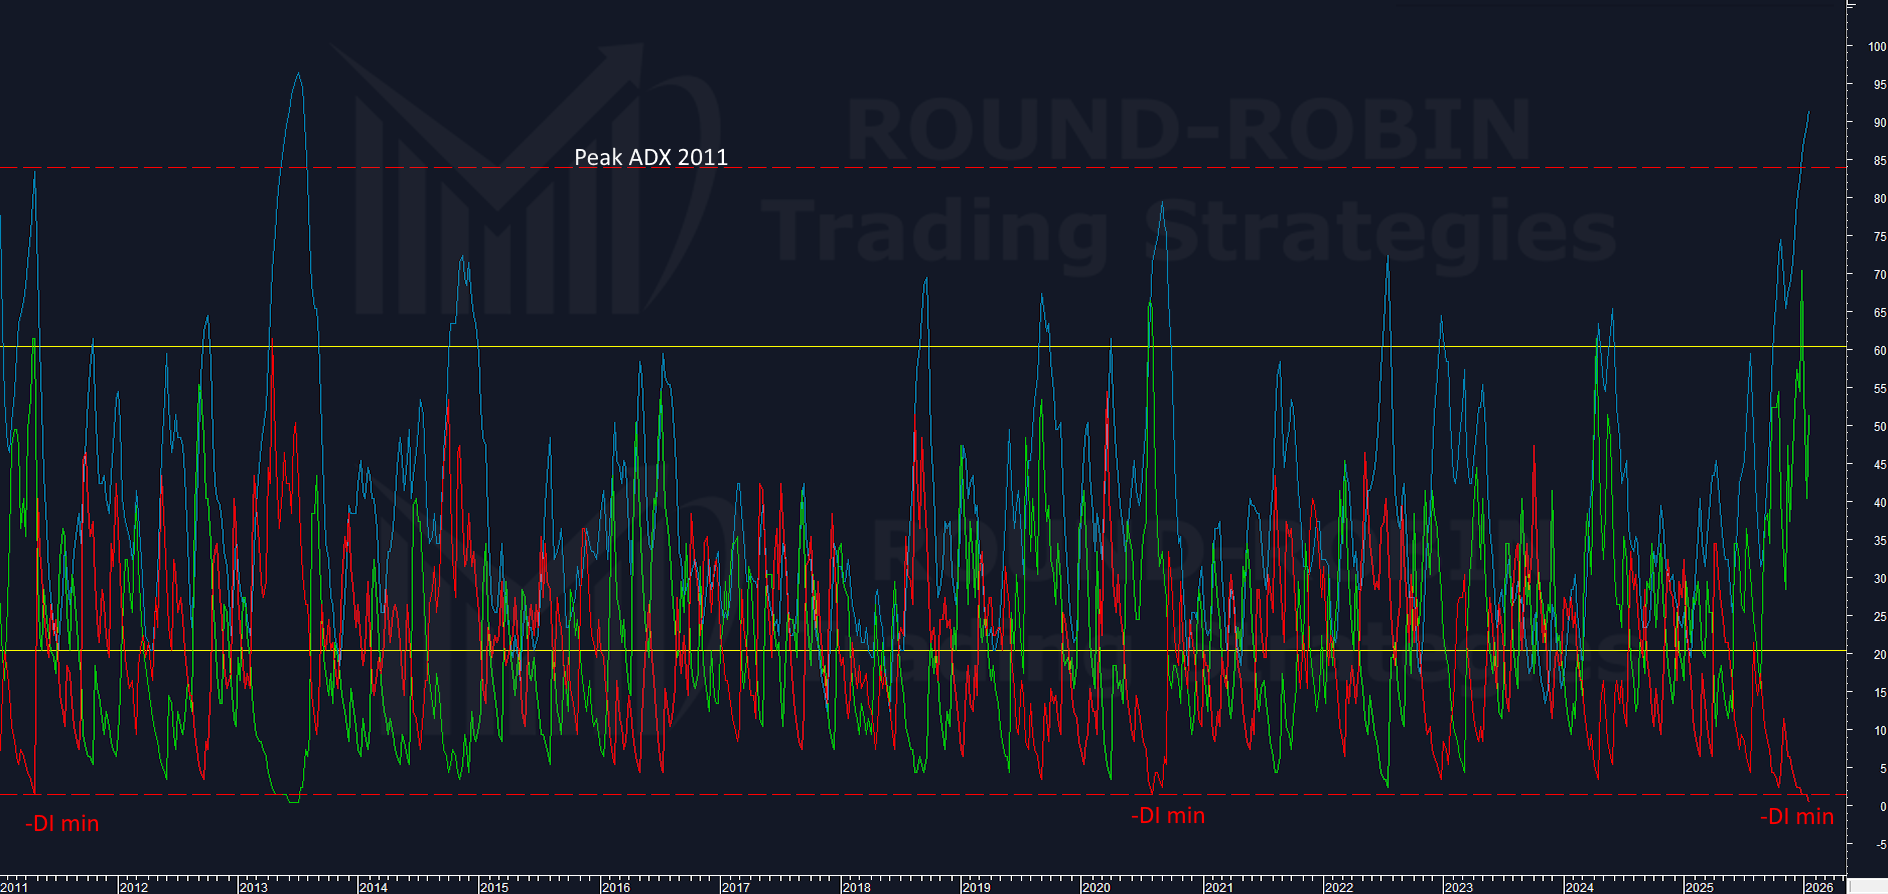
chart: Silver ADX weekly (Jan 16)
ADX: extended to limits never touched before. Not even in 1979-80.
-DI: at minimums, exactly like 2011 and 2020.
What History Said
Every single time these excesses appeared, the same sequence followed:
2020: Fast MA extensions → consolidation → lower highs and lower lows → deeper decline → full wipeout
2011: Vertical selloff → bounce → lower relative high → full wipeout
1979-80: Most extended of all. Completely reabsorbed.
The pattern was clear: the first correction doesn’t eat the entire move. The full reabsorption comes after the first lower relative high.
The Follow-Up (Week of January 23)
Despite the continued rally, overextensions shattered the records of the last 25 years (except MA5W). The thesis didn’t change. The numbers didn’t change. The bubble was still intact.
What We Proposed
The Timing Dilemma
Two approaches were presented:
Anticipate: Enter with reduced exposure, accept the risk of premature timing.
Wait: Wait for a weekly reversal candle — a candle with lower highs and lower lows.
And then the warning:
“The weekly reversal candle has often been large in size and waiting for it could mean missing a considerable chunk of the first correction.”
The Strategies
Long Put ATM — rewarding approach, controlled loss.
Cautious short, scaling in — for those comfortable with directional positioning.
Short calls OTM avoided — uncontrolled loss exposure in bubble mode.
Long Gold Short Silver spread — introduced in the follow-up as a way to smooth out timing risk. Not a directional bet. A rebalancing tool. For those uncomfortable with pure timing.
Example — $10,000 per leg, on Friday 30th close:
Long Gold on Jan 23 close (4979.70): −4.71% → −$471
Short Silver on Jan 23 close (101.335): +22.50% → +$2,250
Total: +$1,779
Gold lost. Silver carried. The spread smoothed the timing risk a pure short couldn’t.
What Actually Happened (January 30)
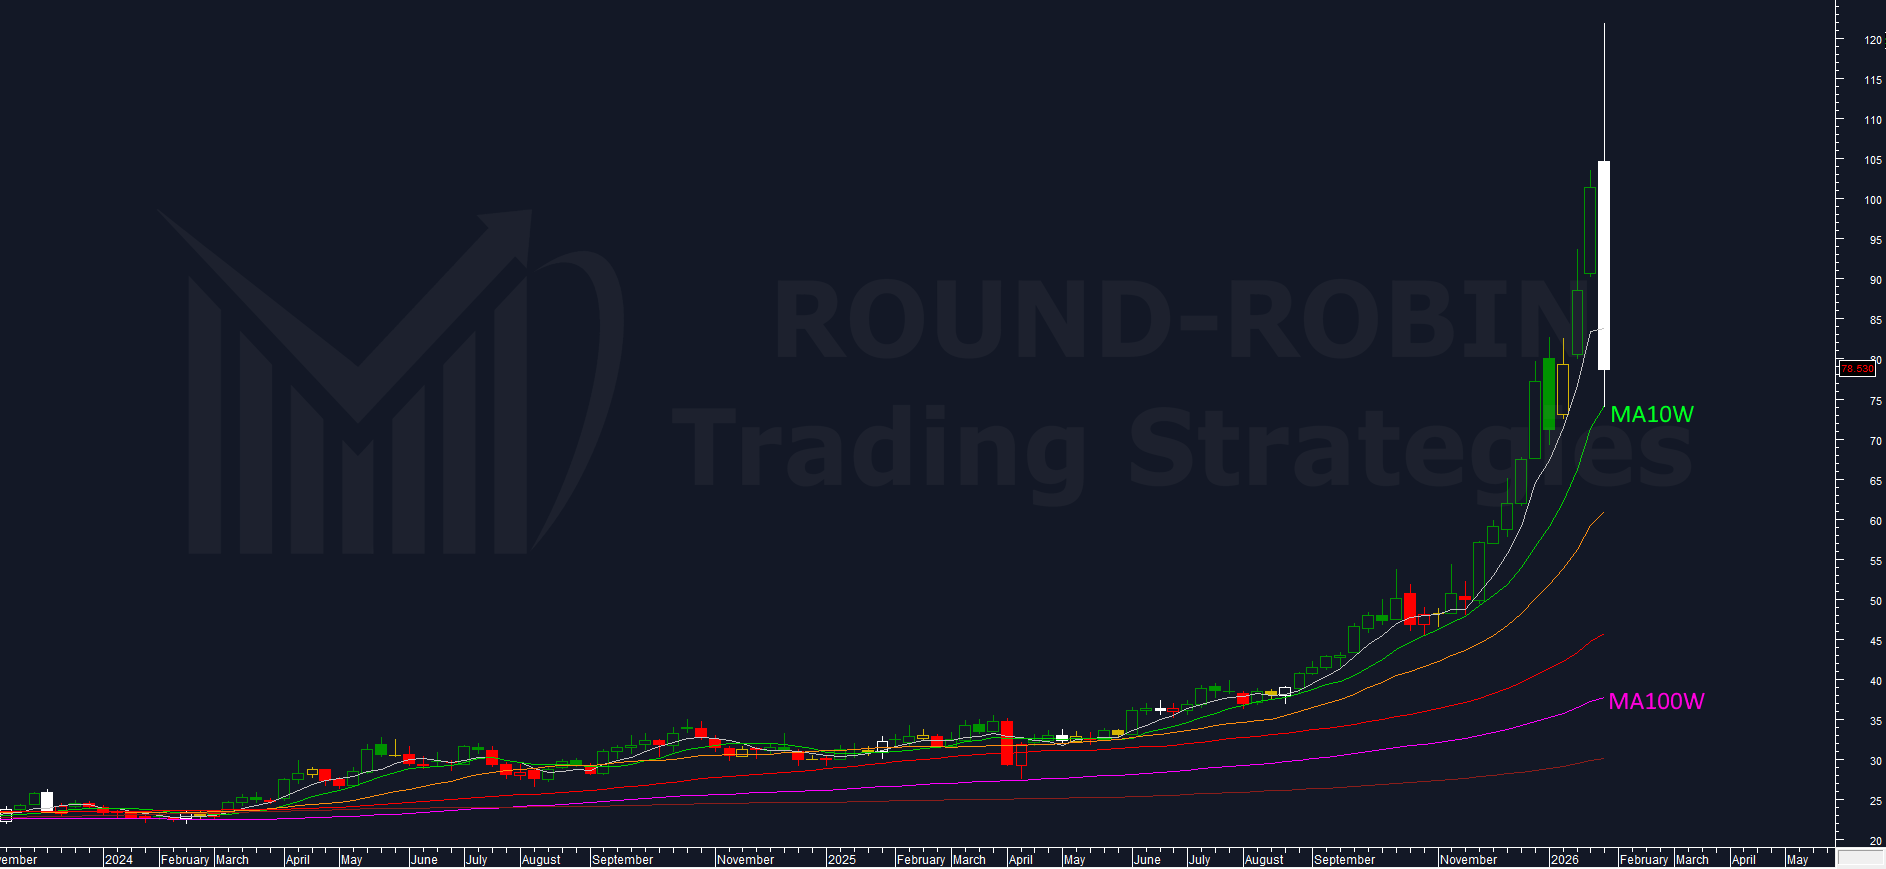
chart: Silver weekly chart
-31% in a single day. A few hours.
Now here’s where it gets important.
Beginner voice: that’s the reversal candle. Textbook. Exactly what you warned about.
No. There is no weekly reversal yet. Friday’s weekly candle hit $74 — perfectly on the MA10W — and closed at $78.53. That’s not a reversal. That’s a test. A brutal, historic test, but on the weekly timeframe the trend is still intact.
If a weekly reversal materializes next week, the crash from the peak will be even larger. And it will already wipe out a consistent part of any potential gain you might be thinking about now.
That’s why you shouldn’t touch the Silver.
The Body Size
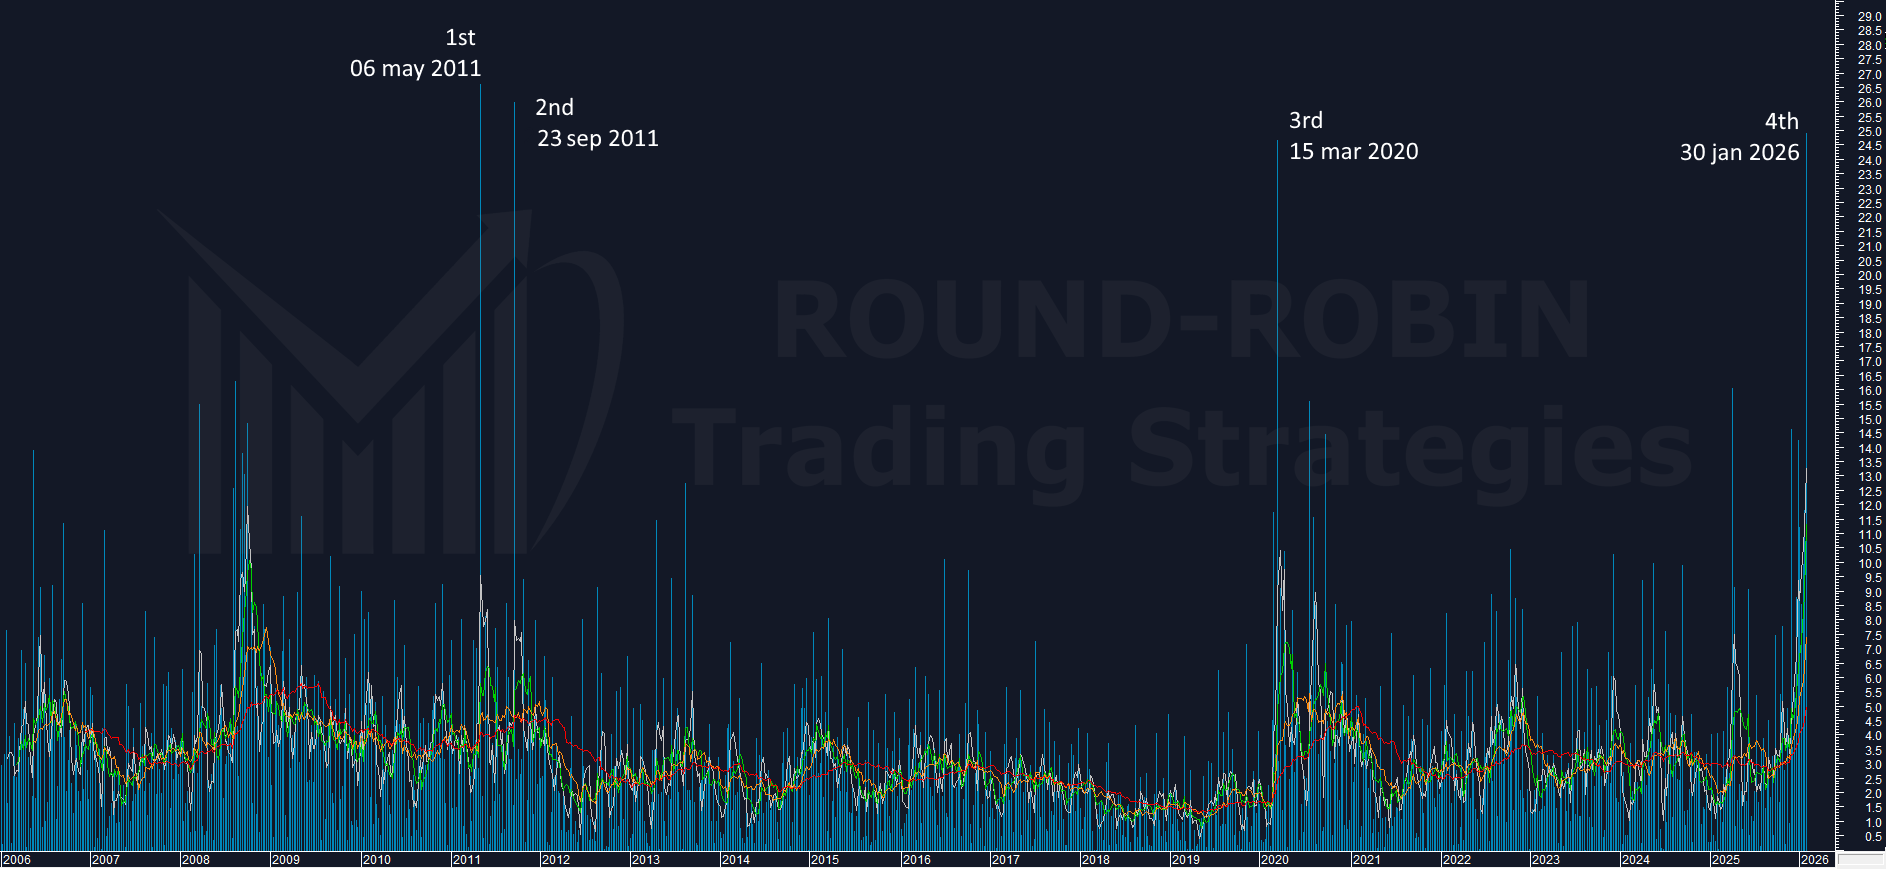
chart: Silver weekly body size in %
This is where it gets interesting. Let’s look at the numbers.
The body of Friday’s weekly candle — the absolute value of close minus open — was $26.07. That’s the all-time high in points.
In percentage terms it ranks 4th ever.
Now. What happened in the 3 prior cases?
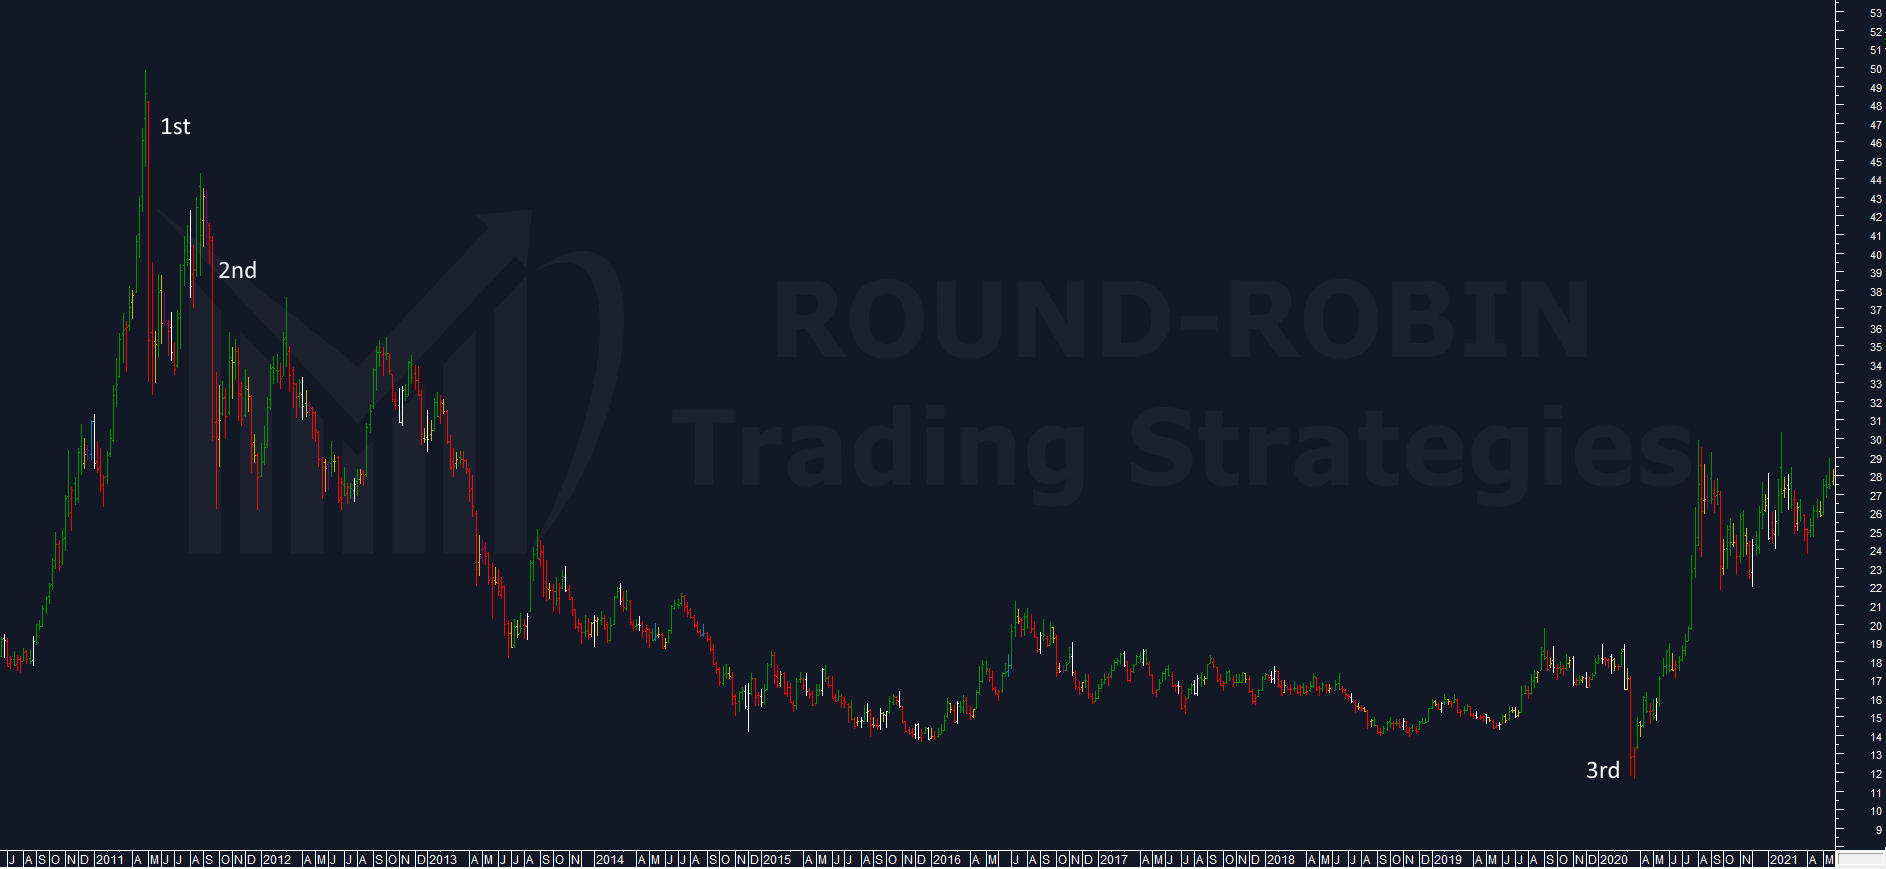
chart: Silver weekly – biggest body size
May 6, 2011 — Massive bearish body on the weekly. Next week: no continuation. A significant bounce developed instead.
September 23, 2011 — The second devastating candle. This was the one that triggered a multi-year bear market. The bottom was found on March 15, 2020.
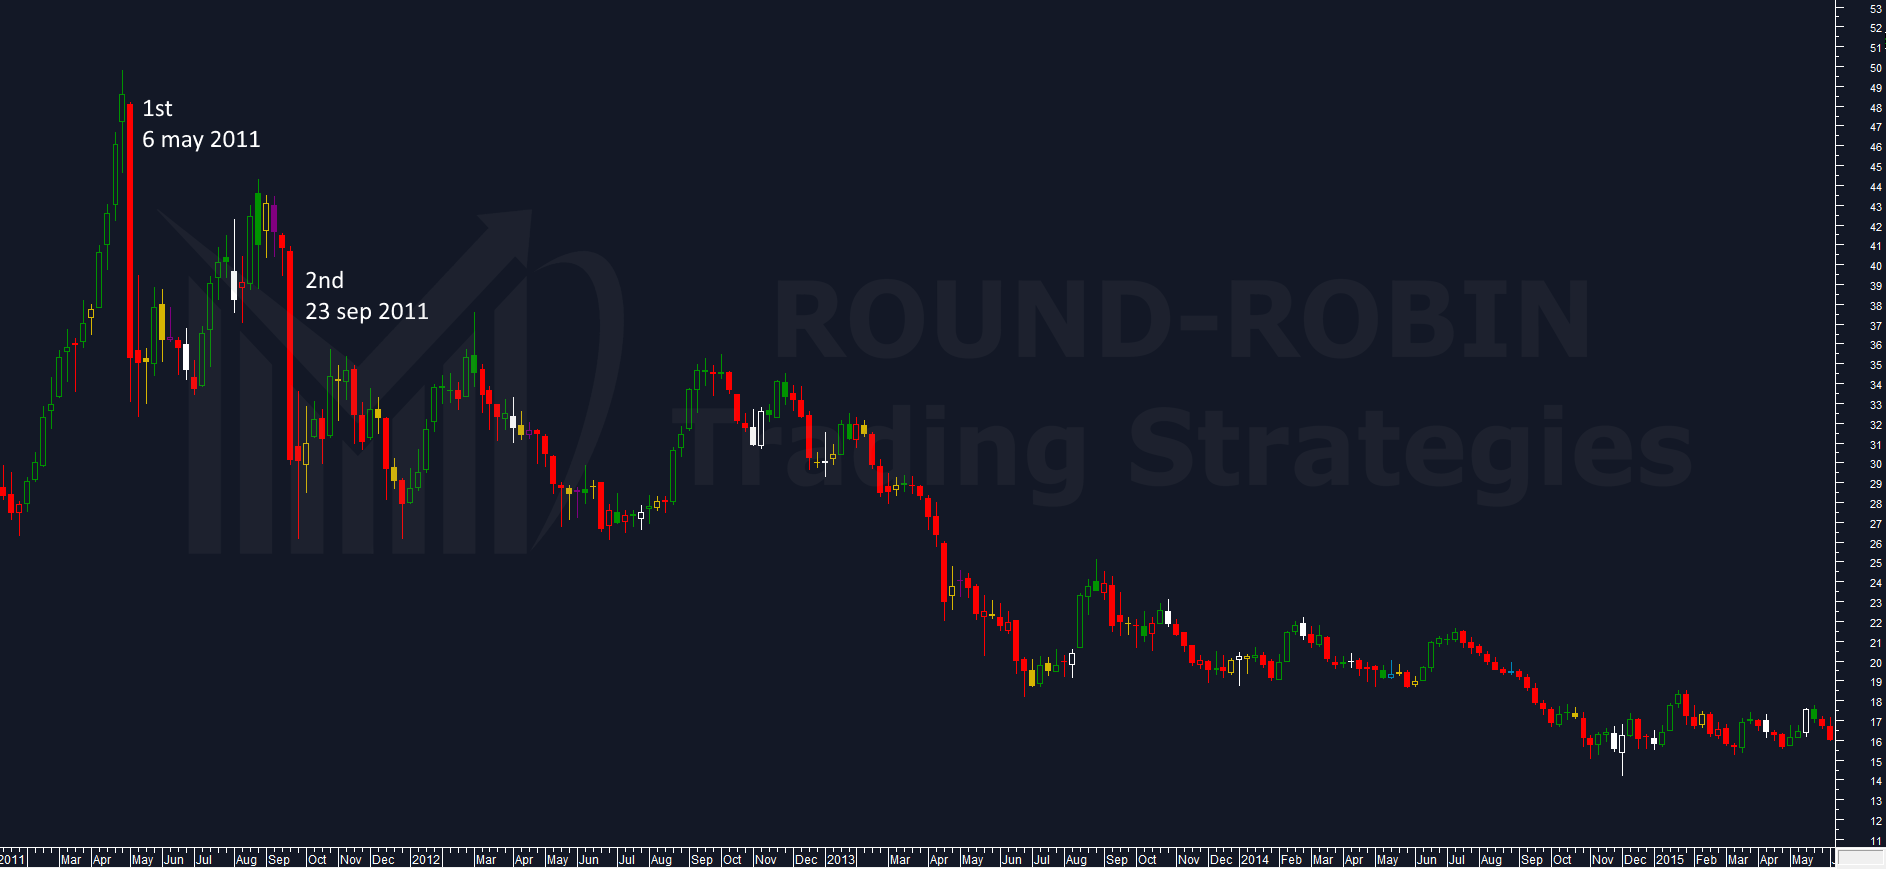
chart: Silver weekly – biggest body size % (zoom 2011)
March 15, 2020 — The third largest body in percentage terms. From there the market started climbing relentlessly. Until when? January 30, 2026. Where we find the 4th.
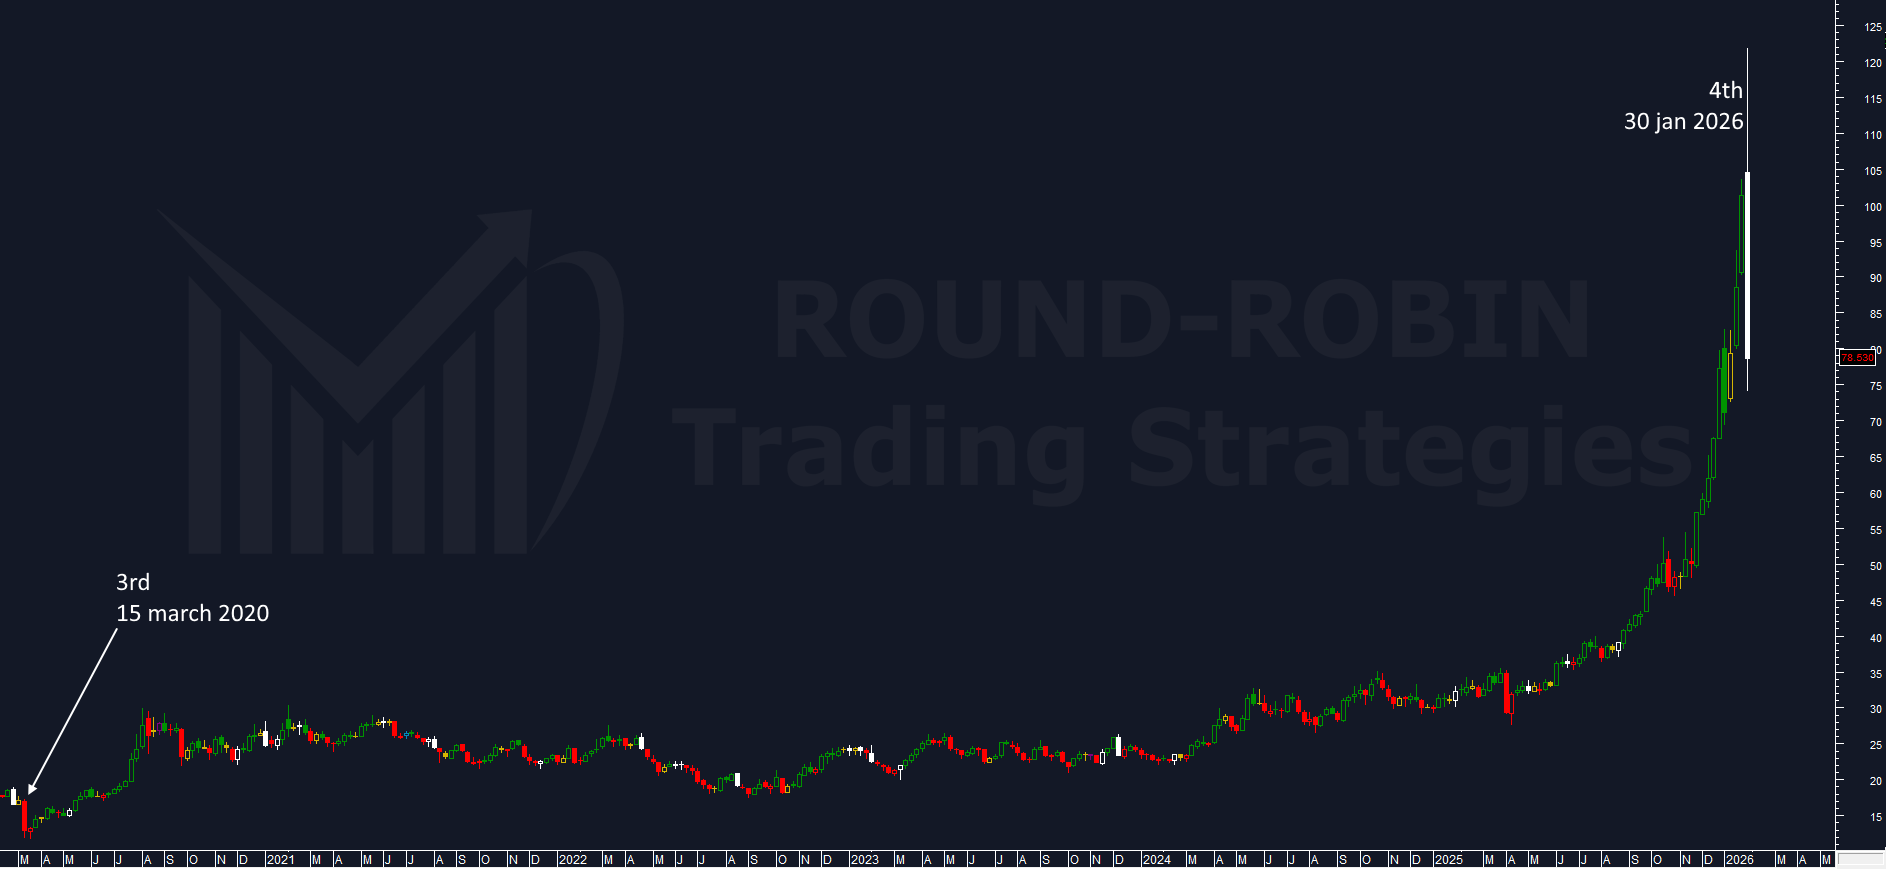
chart: Silver biggest body size % 2020-2026
A chain. Maybe a coincidence. But one worth keeping in mind.
The first case is particularly relevant right now: the big body did not lead to immediate continuation.
A bounce came first.
What Comes Next
Beginner: it’s going to keep crashing.
Not necessarily. Not immediately. History says no — but it’s not math. It’s what happened in the prior cases.
What we should expect — consistent with the prior cases — is a bullish bounce. What older traders used to call a dead cat bounce. (Today they’d probably get sued by animal rights activists.)
A sharp, violent move up that looks convincing but lives inside a larger bearish structure.
If that bounce happens, that’s the opportunity. For those who know how to read it.
What To Do Now
This is simple. Simpler than three weeks ago.
If you traded towards the bubble burst — you already know where you stand. The first leg is done. Sit with it.
If you used spread trading (Long Gold Short Silver) — don’t touch it. You can ignore it for months. If a substantial weekly bounce develops, consider scaling in.
If you are out of the market — stay out. If a real weekly bounce develops, that’s your next entry point for shorting. Anything before that is gambling.
If you are long from above $80 — we know what you’re going to do. You won’t sell if it drops another 10%. You’ll sell on the bounce. Which is exactly what the bears need. If you’ve been long longer and at lower prices and got hit by Friday’s tsunami — at least don’t erode the position further.
Trading Silver right now, in any direction, is a lottery.
Conclusion
Fifty years of data. Three epic rallies. All completely reabsorbed.
Historical excesses reached on every indicator. A -31% day that confirmed what the numbers were already showing.
This isn’t about being right. It’s about what the data said, what the strategy suggested, and respecting both — before and after the event.
The weekly chart on Friday was, in terms of trend, a blip. The real story unfolds in the coming weeks. Watch the weekly.
If the bounce comes, that’s when the next chapter begins.
The analyses published have educational purposes and method sharing. They do not constitute financial advice nor investment solicitation.
You read all of this. You know what it’s worth. Soon only members will access this content. Subscribe free.
Leave a Reply