


Quick observations on the charts that caught our eye this week.
This week’s flash covers Silver, Bitcoin, EUR/USD and Gold – four markets where stalling price action, inside candles, and looming signals are building tension across the board.
This is not meant to be a full analysis – just food for thought on a few charts that caught my attention this week.
⚡ SILVER
Our Silver story began with a Chart of the Week in which we laid out why Silver had a high probability of crashing (I think it’s worth reading if you haven’t already).
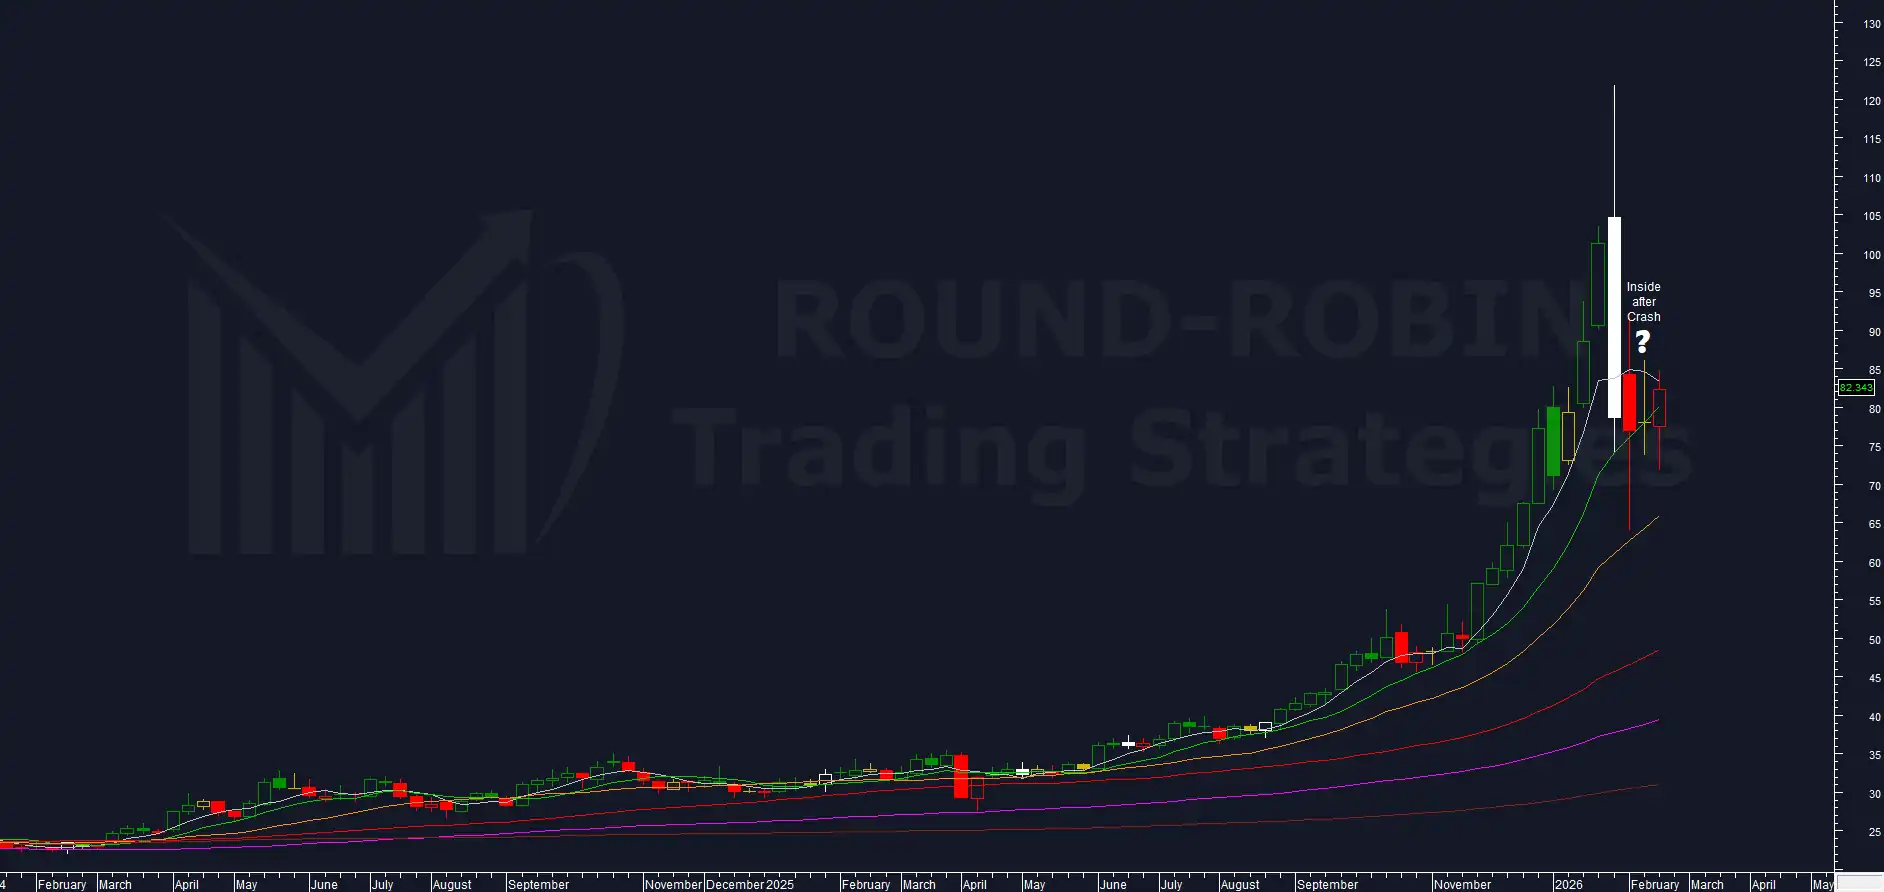
chart: Silver weekly
The core assumption remains: the current relative low is not the bottom.
Last week’s inside candle reinforced this view, and this week delivers the same message – statistically speaking, this short-term low should not be the medium-to-long term low.
So, for the third consecutive week, the indication is the same: do not touch Silver.
The strategy:
- We wait for the $85-$92 zone AND a bearish price signal to open medium-to-long term bearish positions.
- Bullish alert only with strong price signals above $92 – the high of the candle that printed the current short-term low ($63.9).
⚡ BITCOIN
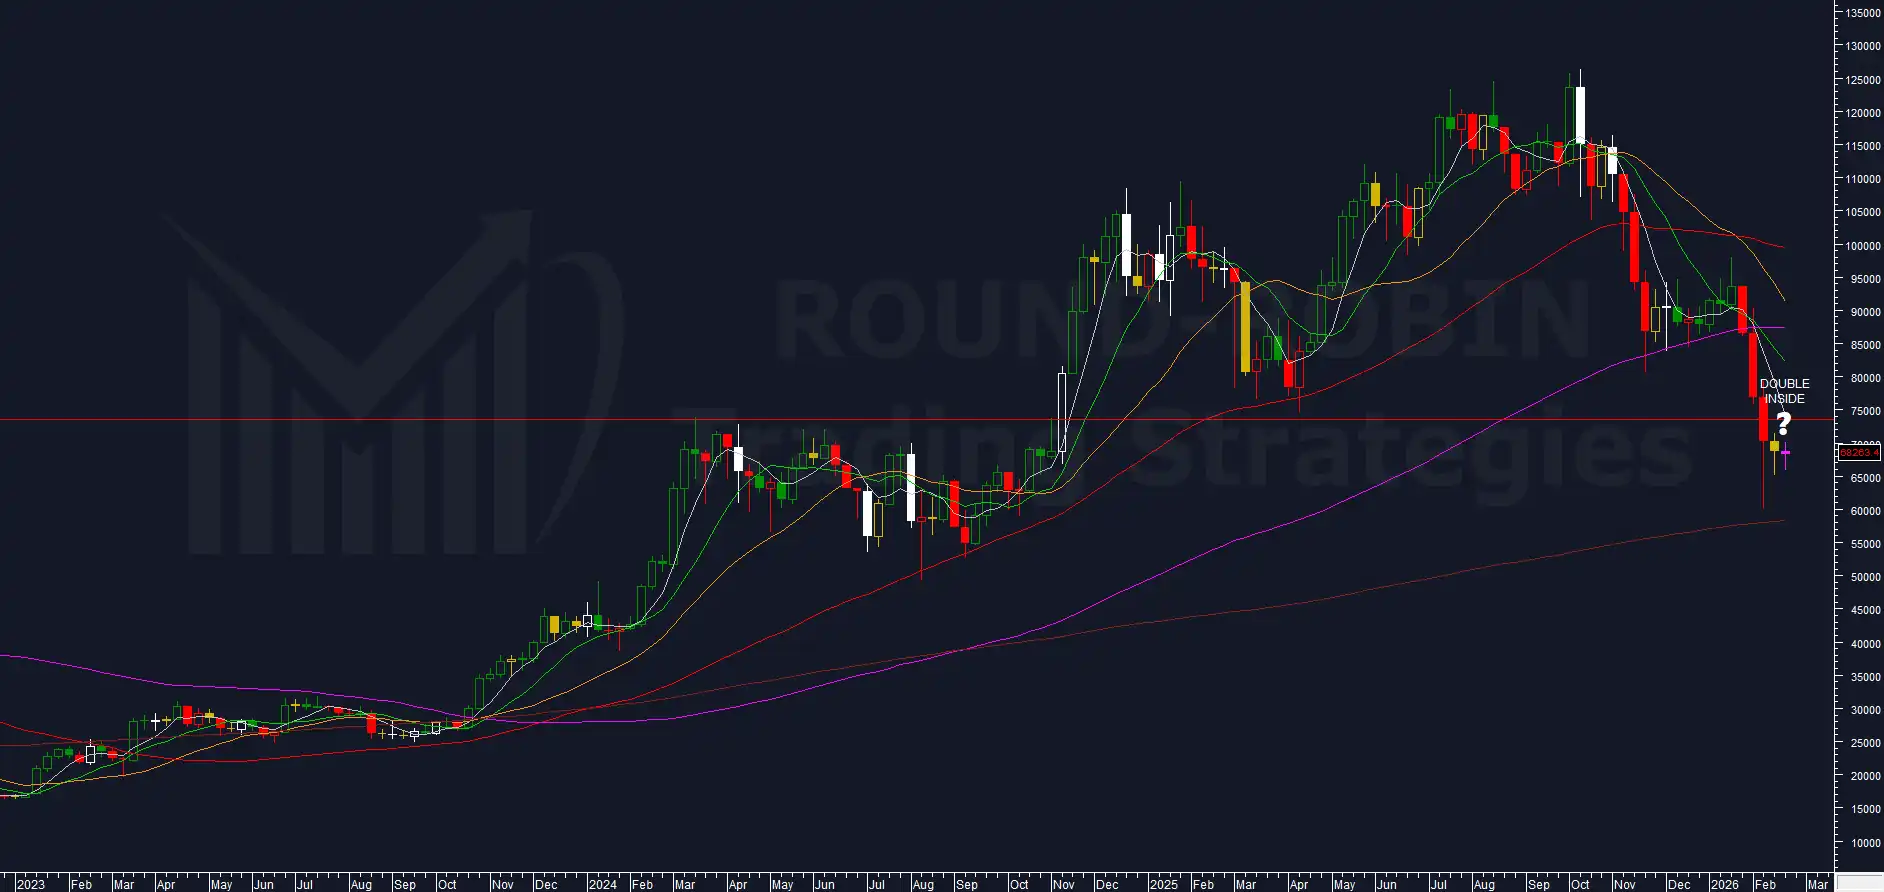
chart: Bitcoin weekly
One of the rarest weeks on Bitcoin – the king of crypto certainly didn’t become famous for its lack of volatility.
And yet, this is the second consecutive week closing with an inside candle.
This has only happened 3 other times since 2017, but in technical and trend contexts that are not comparable to the current one.
By cross-referencing traditional oscillators (weekly oversold readings) with our proprietary algos, we still get confirmation that the minimum target – first identified in our Charts Flash Week 4 – for the move that started from the October 2025 high ($126,000 area) should be found around the MA200W ($58,000 area).
Since the January-February 2026 plunge, prices have not reached the $72,000-$75,000 zone again. This area should act as resistance, and a confirmed rejection there with a bearish price signal could trigger the final bearish wave toward the minimum target.
Weekly closes with a price signal above $75,000 could allow BTC to reclaim the MA100W around $85,000, undermining bearish conviction – which would be completely erased by closes above that latter zone.
⚡ EUR/USD
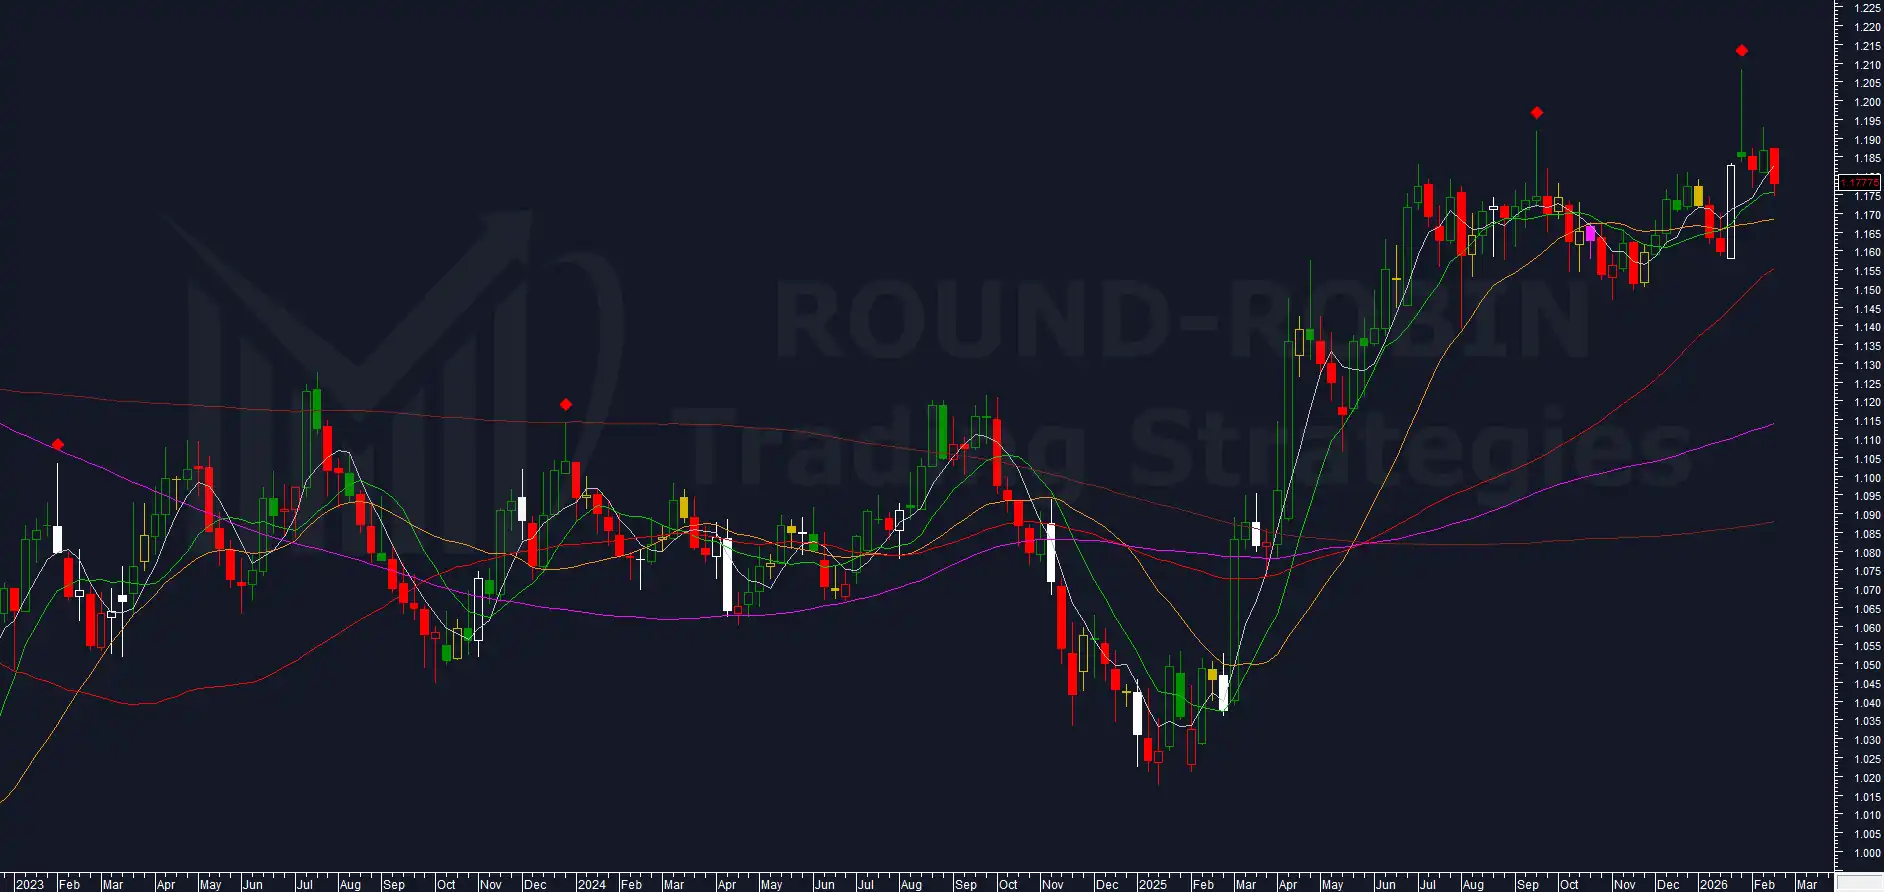
chart: EUR/USD weekly
As covered in last week’s Charts Flash, we were waiting for a price signal to confirm the Shooting Star – and it didn’t come.
In the final hours of Friday, EUR/USD posted a slight bounce from the weekly lows – small, but enough to prevent the short signal that would have confirmed the Shooting Star.
EUR/USD is yet another asset in stall mode. Indices are stalling at highs; Crypto and Precious Metals, after their respective crashes, have neither bounced meaningfully nor continued lower.
The strong hypothesis is that once EUR/USD enters bear territory, equity indices should also align to the downside – at least in the short term. But for now, EUR/USD – just like the S&P500 – is holding.
⚡ GOLD
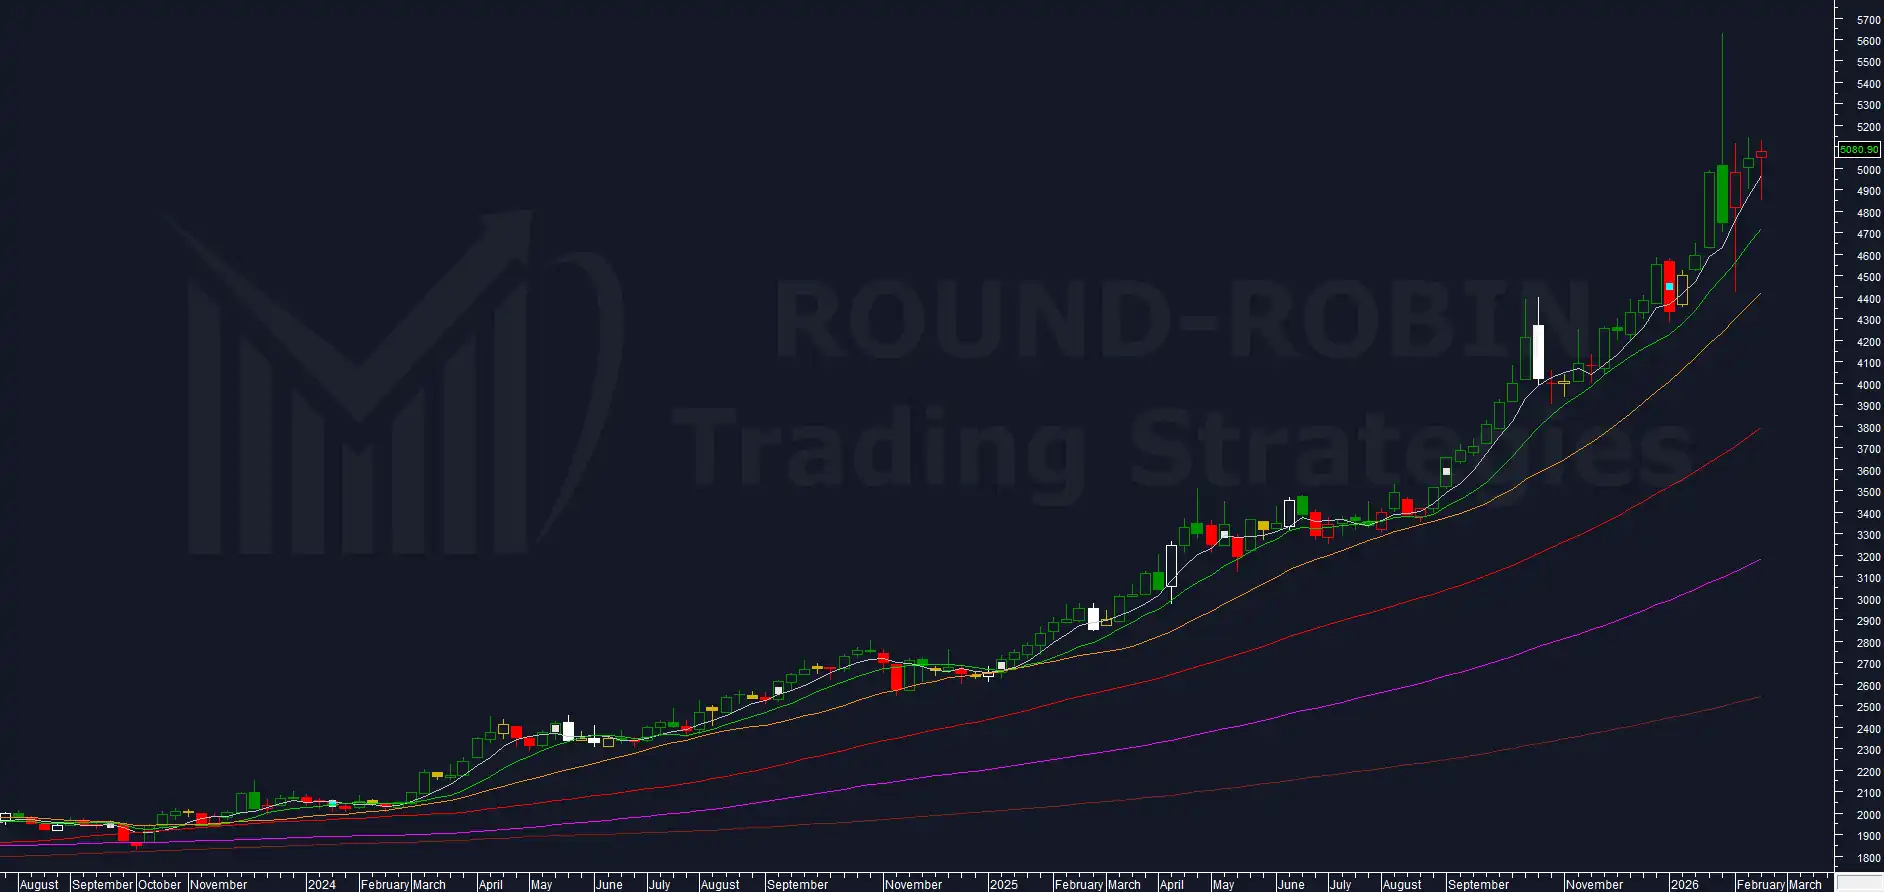
chart: Gold weekly
As discussed in last week’s Chart of the Week, despite the crash visible on the weekly candlestick chart, Gold has maintained its positive trend.
This week it printed a new all-time closing high at $5,080.90 – a slight improvement, but still a record – holding above the MA5W with all other moving averages still positively sloped and aligned from fastest to slowest, as is typical in bull markets.
Gold is gradually entering the long upper shadow from January 30th, where we have one certainty: bears are present.
The combined study we proposed last week – our proprietary Volatility indicator + weekly RSI – suggests a trend reversal within 5 weeks (next week will be the second).
The strategies remain the same as in prior weeks:
- Spread trade: Long Gold + Short Silver – which should pay off especially in a bear market scenario.
- Only Gold: Wait for a bearish price signal along the upper shadow of the January 30th, 2026 candle.
Leave a Reply