


Quick observations on charts that caught our attention this week.
This week’s flash covers Bitcoin’s concerning parallel with 2022, and a Silver follow-up: despite the rally, the bubble thesis remains intact.
This isn’t meant to be a full analysis — just food for thought on a few charts that caught my attention this week.
⚡ BITCOIN
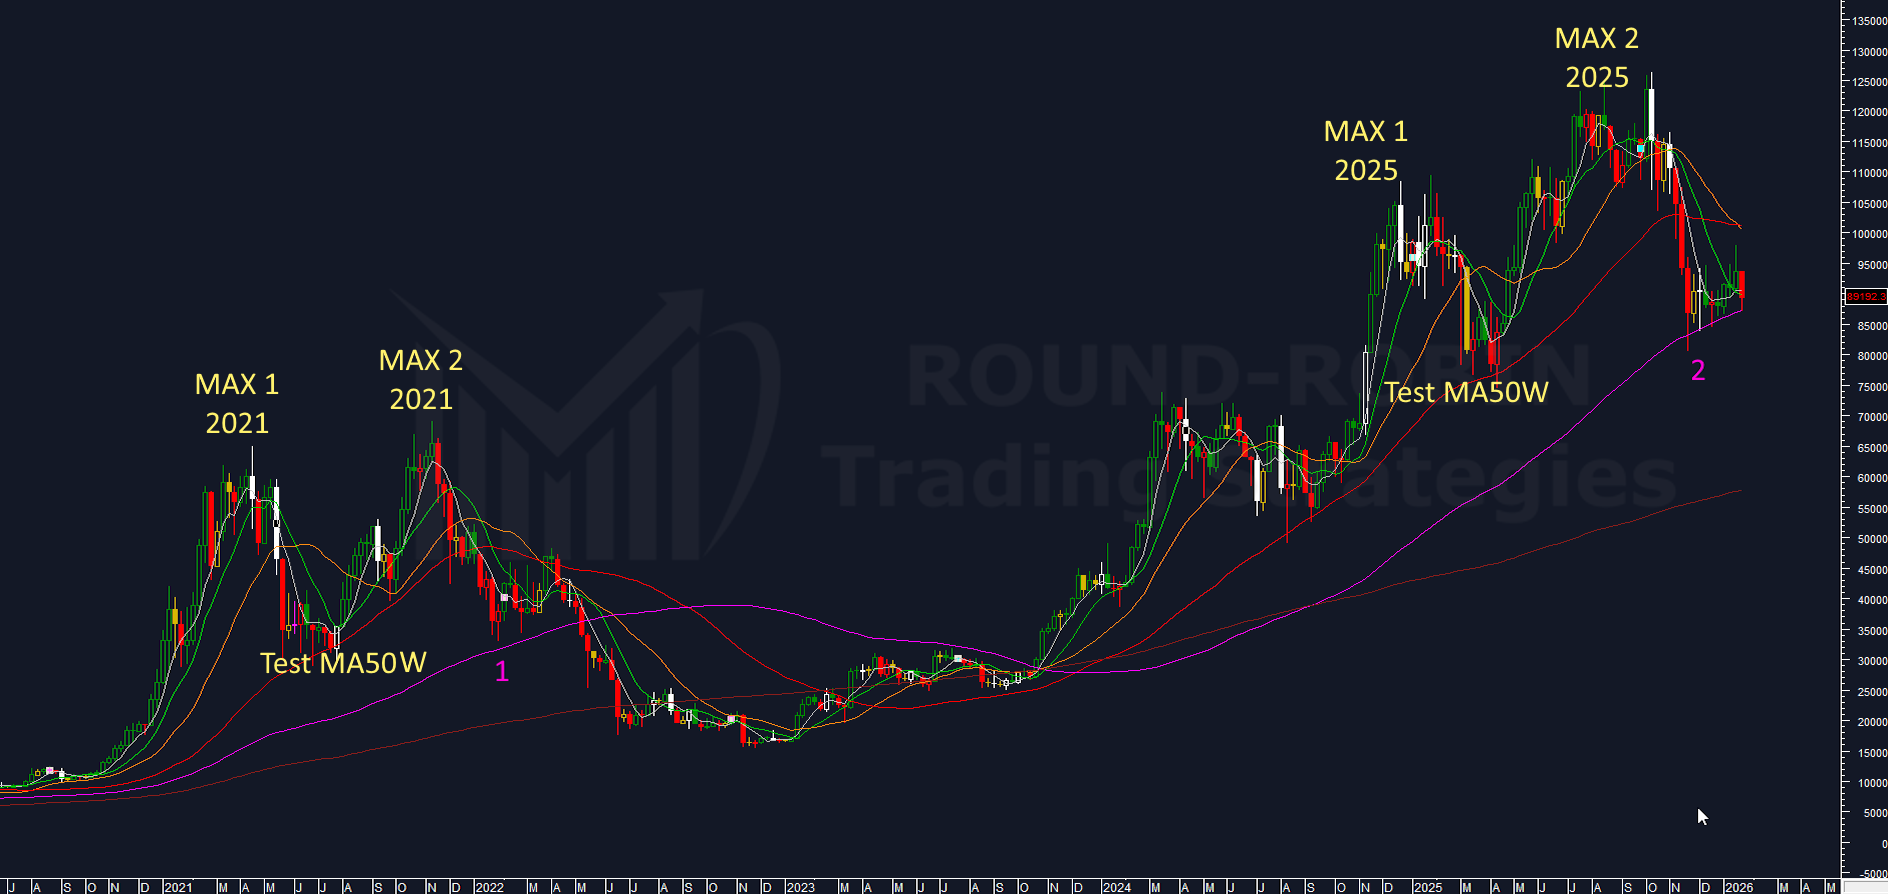
chart: Bitcoin and MA100W
The weekly chart shows an interesting parallel.
What happened in early 2022:
- Prices broke through the MA50W (red)
- Dropped to the MA100W (purple)
- Made a weak bounce and stayed above it for several weeks
- Pulled back to the MA50W
- Broke the MA100W and crashed down to the MA200W
December 2025 setup — remarkably similar:
- Break of the MA50W
- Hold at the MA100W
- Lingering for multiple weeks near the MA100W
Also note how the formation of the 2021 and 2025 peaks is very similar, with a central dip right on the MA50W that allowed a rally toward a new high.
What now?
I don’t know, but I’d watch the MA100W closely. If it gives way with a price signal, bears will jump on the bulls’ backs. And remember that, according to K33 Research data cited by Bloomberg, $89,000 represents the average cost basis for US spot Bitcoin ETF holders. So going below that could really trigger panic selling.
⚡ SILVER
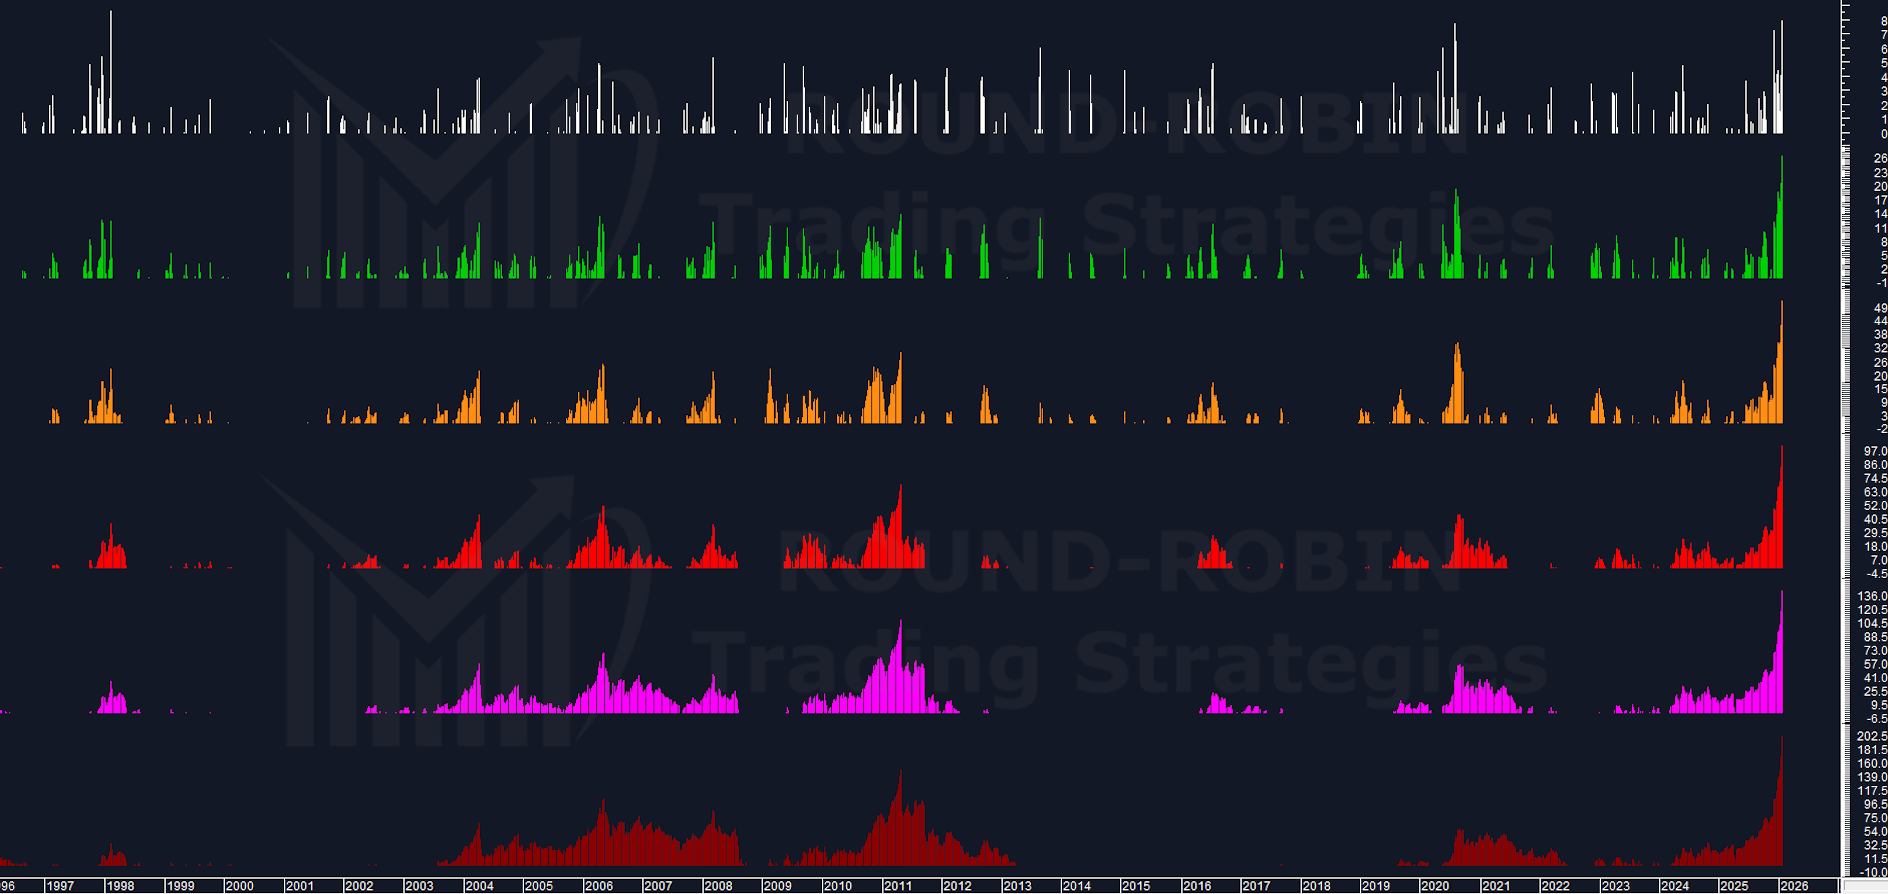
chart: Silver Overextension on MA5-10-20-50-100-200
A follow-up to our chart of the week from last week (which you can read here).
Looking at the overextensions: except for the MA5W, all the others have shattered the records of the last 25 years.
The underlying thesis, despite this week’s strong bull action, hasn’t changed — the current trend is a bubble, and that’s what the numbers say.
The trading ideas haven’t changed either: enter short cautiously and scale in, or enter on a price signal if it’s not devastating (I refer back to the post linked above).
An alternative approach that aims only at rebalancing the situation could be spread trading: Long Gold Short Silver. This might slightly smooth out timing risk (this is what we’re going to explore in next week’s Chart of the Week).
Leave a Reply