


Quick observations on the charts that caught our eye this week.
This week’s flash covers S&P500, Silver, Bitcoin, EUR/USD and Gold – with Silver finally reaching a key level, Bitcoin pressing lower, Gold setting another record, and the S&P500 still glued to the same moving average.
This is not meant to be a full analysis – just food for thought on a few charts that caught my attention this week.
⚡ S&P500
Fourth consecutive week testing the MA20W – and the fifth out of the last six.
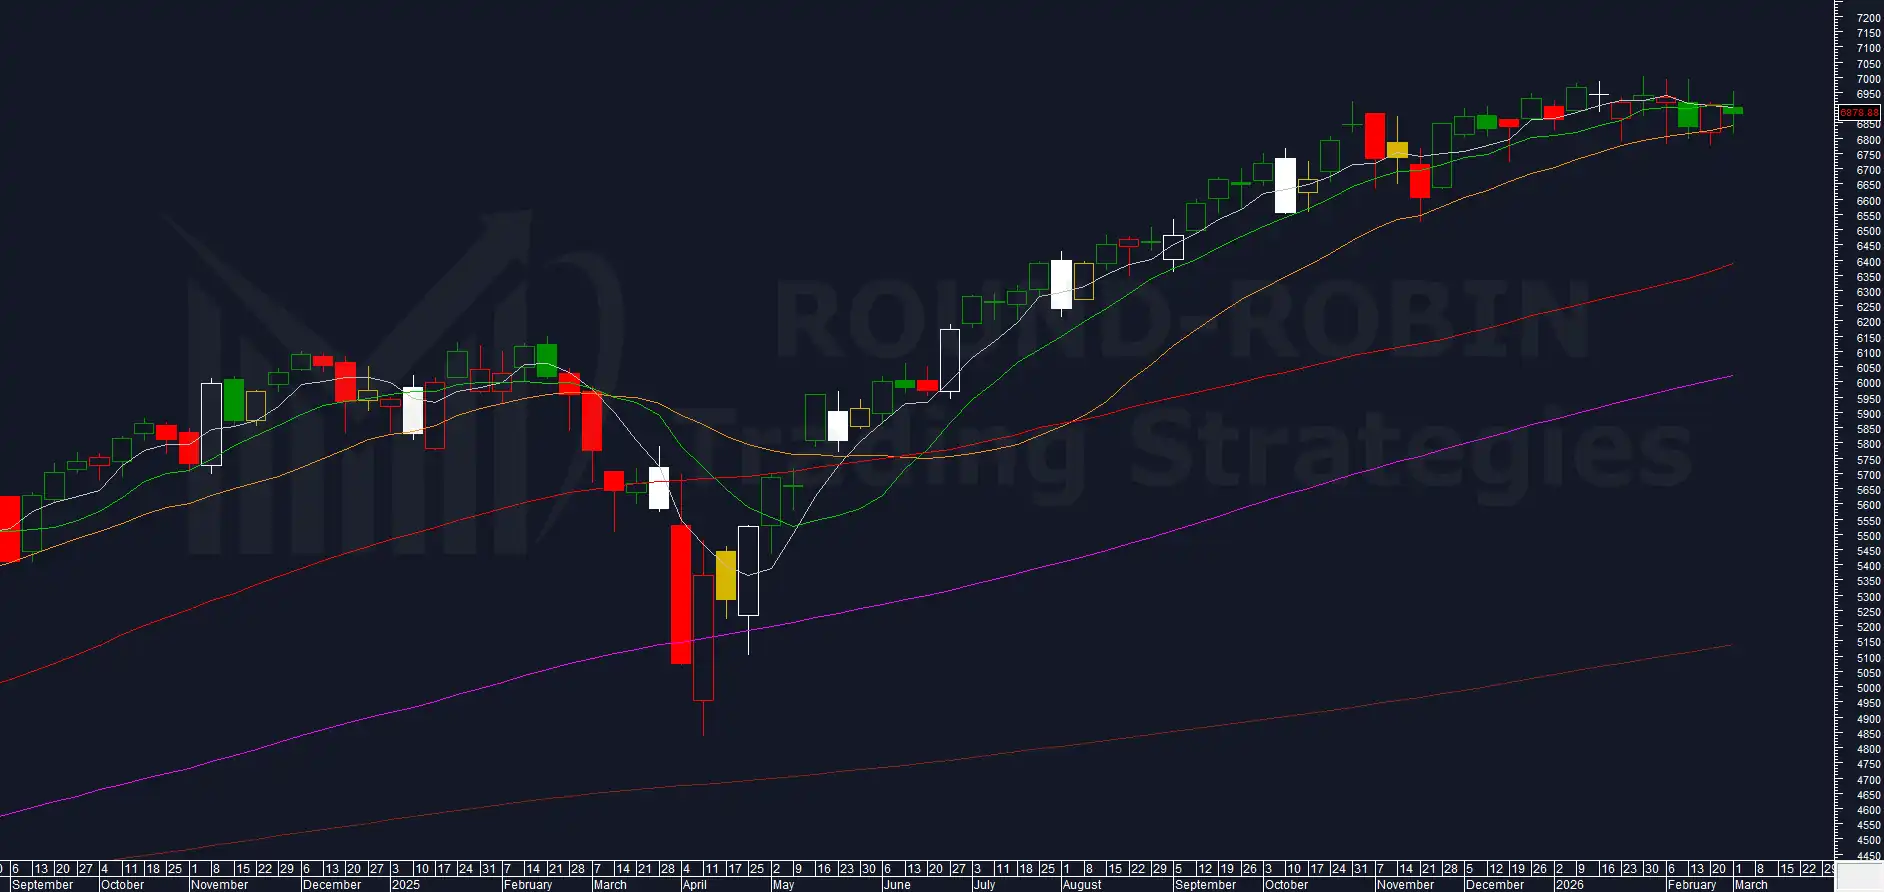
chart: S&P500 weekly
Nothing to add. Everything laid out in last week’s Chart of the Week remains fully valid – the rounding pattern, the volatility indicator reading, the overextension cycle, and the strategic framework are all unchanged.
MA20W holds. Again. As we’ve stressed since our first S&P500 deep dive – the MA20W has been the support line for every rally since 2020. Bull above it, bear below it. Until it breaks, the trend stands.
⚡ SILVER
Prices reached and slightly exceeded the $92 level, closing the week at $93.291 – surpassing the upper shadow of the post-crash low candle.
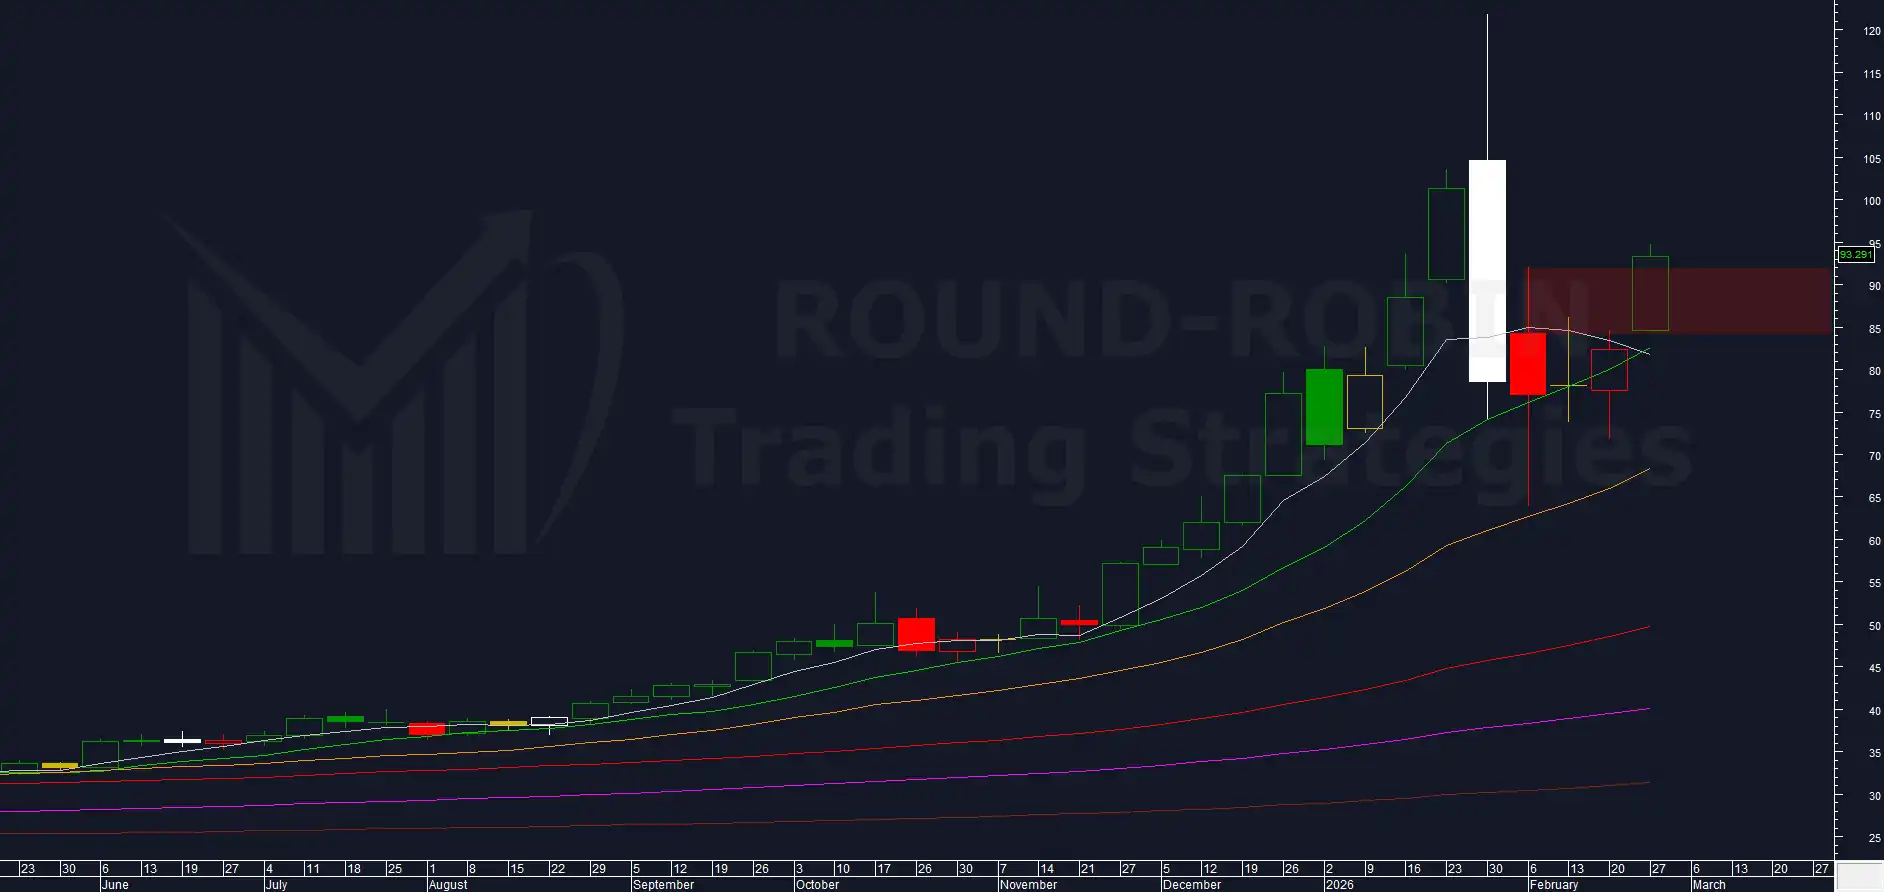
chart: Silver weekly
This is not a true breakout – it’s marginal – but the key point is that no bearish price signal arrived from that zone. Without a bearish signal, the ball is firmly in the bulls’ court.
The stance remains: do not touch Silver. There is no position to manage if you’re not in one.
Next week will be critical to monitor: either prices pull back sharply below $92, or the rally extends further. We are waiting for a strong bearish signal – but if it fails to materialize, bulls will likely aim for the long upper shadow of the all-time high candle.
For the full context on our Silver thesis, see last week’s Charts Flash.
⚡ BITCOIN
Bitcoin made new descending lows this week, with a weekly low at $62,500. Prices remain consistently below the MA5W – the bearish structure is intact and there is no reason to question it.
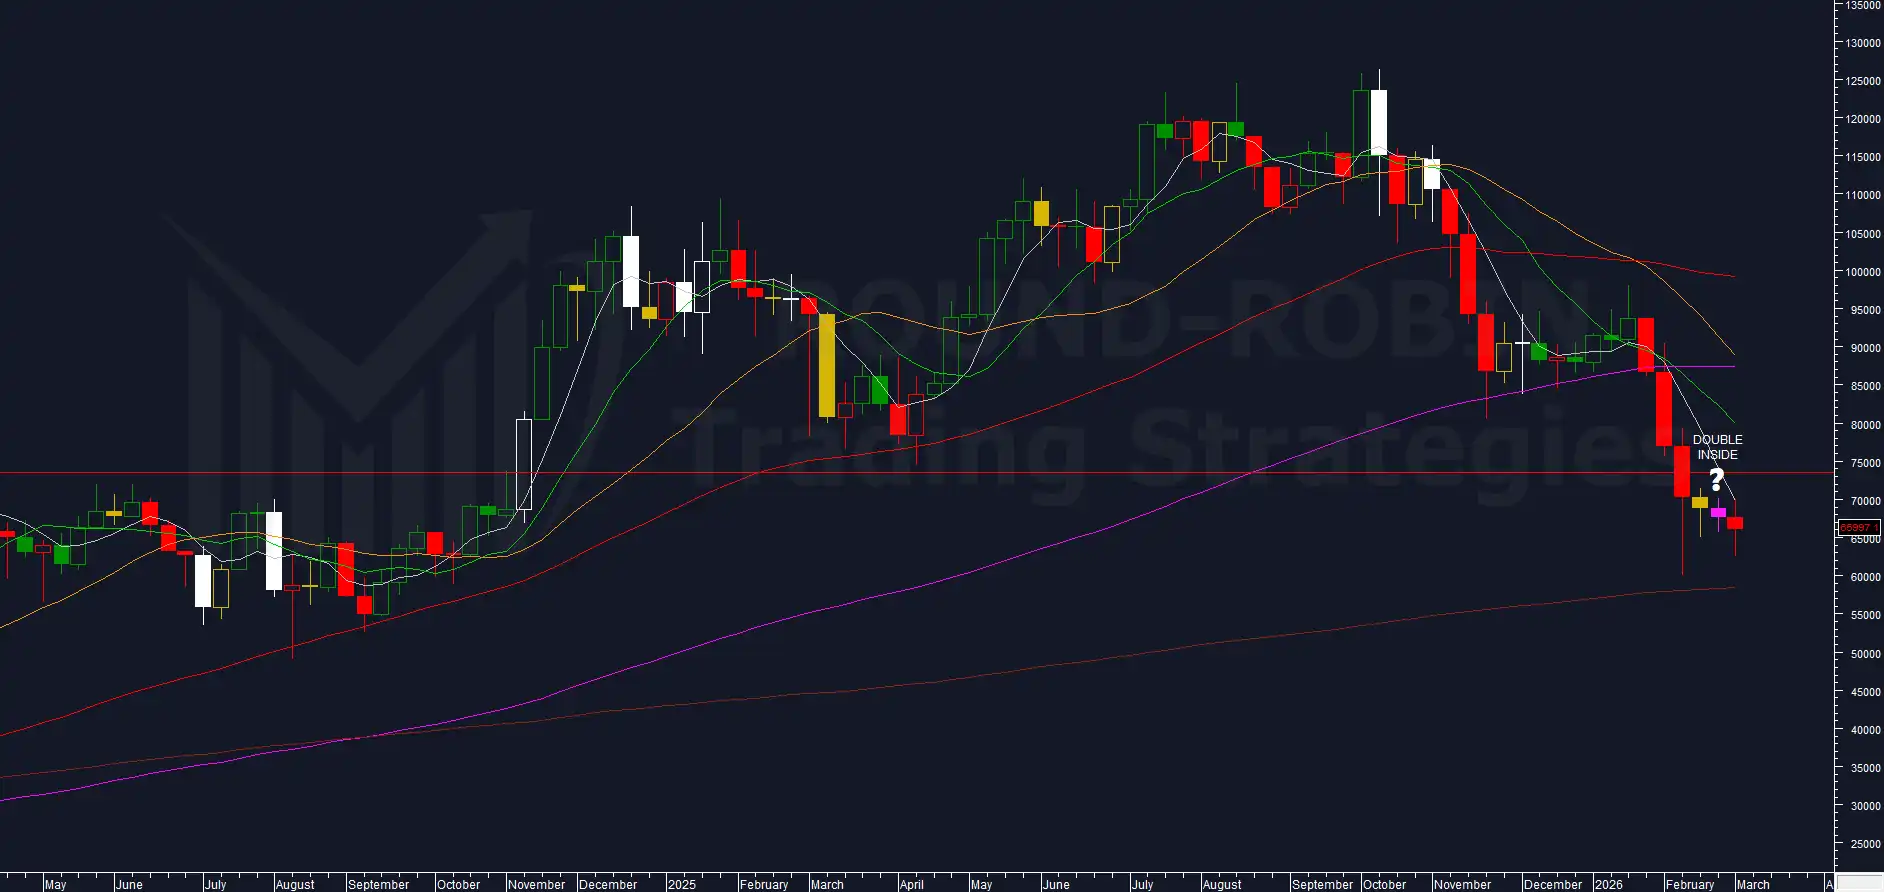
chart: Bitcoin weekly
The minimum target identified since Charts Flash Week 4 – the MA200W around the $58,000 area – is confirmed and has not yet been reached.
A bullish breakout above the MA5W could favor a recovery toward the $75,000 area.
Not much else to add this week – for the full breakdown of levels and scenarios, refer to this Chart of the Week.
⚡ EUR/USD
The confirmation of the Shooting Star we were waiting for didn’t come – again.
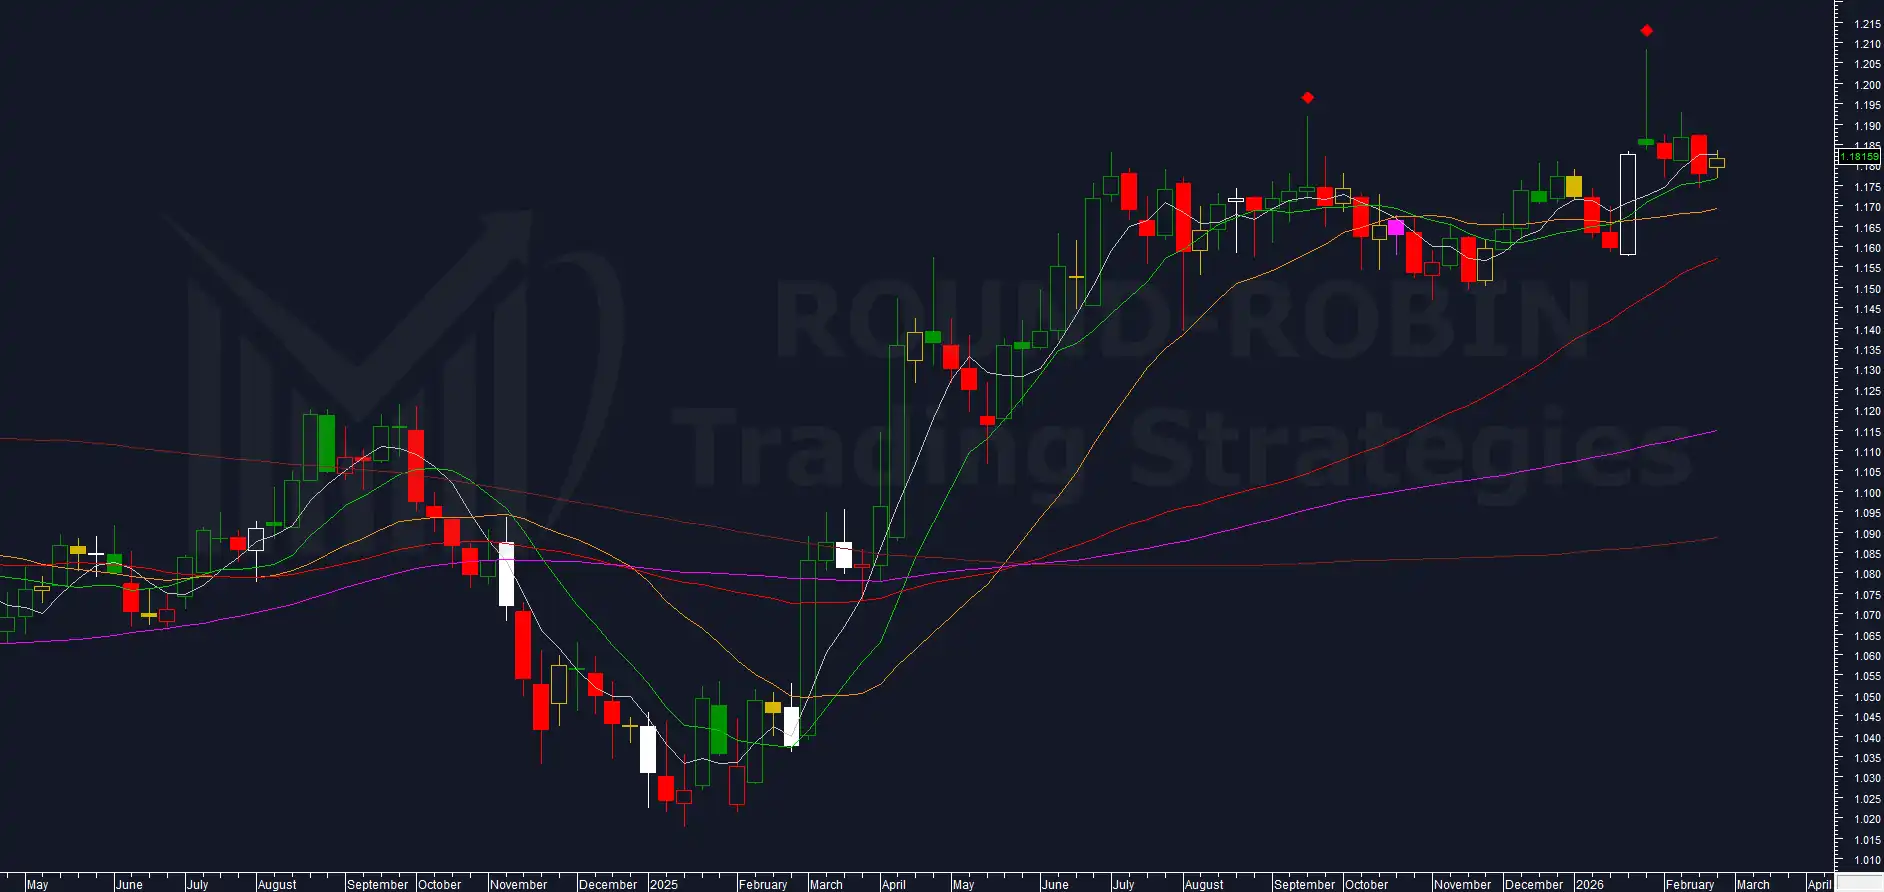
chart: EUR/USD weekly
This week printed a microscopic inside candle. Nothing changes from what was laid out in last week’s Charts Flash. EUR/USD remains in stall mode alongside equity indices.
The strong hypothesis remains: once EUR/USD enters bear territory, equity indices – including the S&P500 – should also align to the downside, at least in the short term.
⚡ GOLD
Gold posted yet another record weekly closing high at $5,247.90. Prices continue to advance into the long upper shadow of the January 30th candle, where we know bears are present.
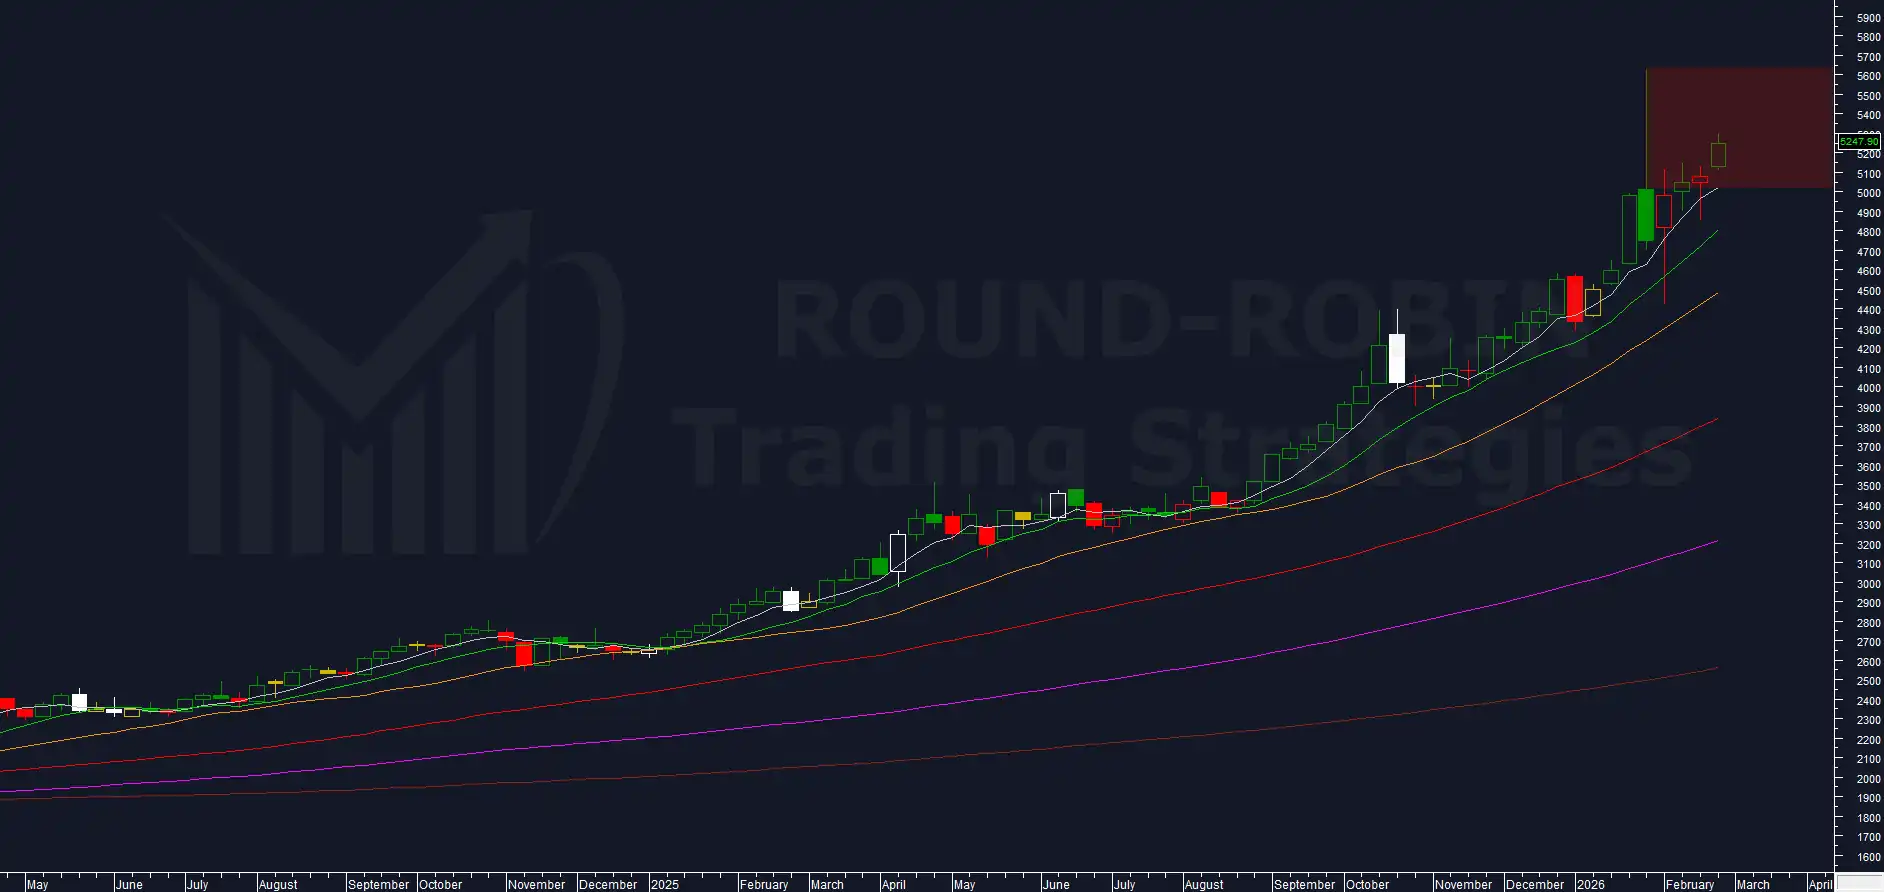
chart: Gold weekly
This is the second week of the countdown from our combined Volatility + RSI study, which suggests a trend reversal within 5 weeks.
The strategies remain the same as in prior weeks:
- Spread trade: Long Gold + Short Silver – we follow the process and respect the trend.
- Only Gold: Wait for a bearish price signal along the upper shadow of the January 30th, 2026 candle.
For the full Gold analysis and strategy rationale, see last week’s Charts Flash.
Soon only members will be able to access this content. Sign up for free.
Leave a Reply