


Weekly appointment with the world’s most watched charts.
The S&P 500 came under pressure at the beginning of the week — the weekly low marked a -2.2% drop from the prior week’s close. But the bulls came back, and by Friday’s close at 6,915.61, the weekly loss was just -0.42%.
Nothing happened? Let’s see what the market told us.
The Big Picture
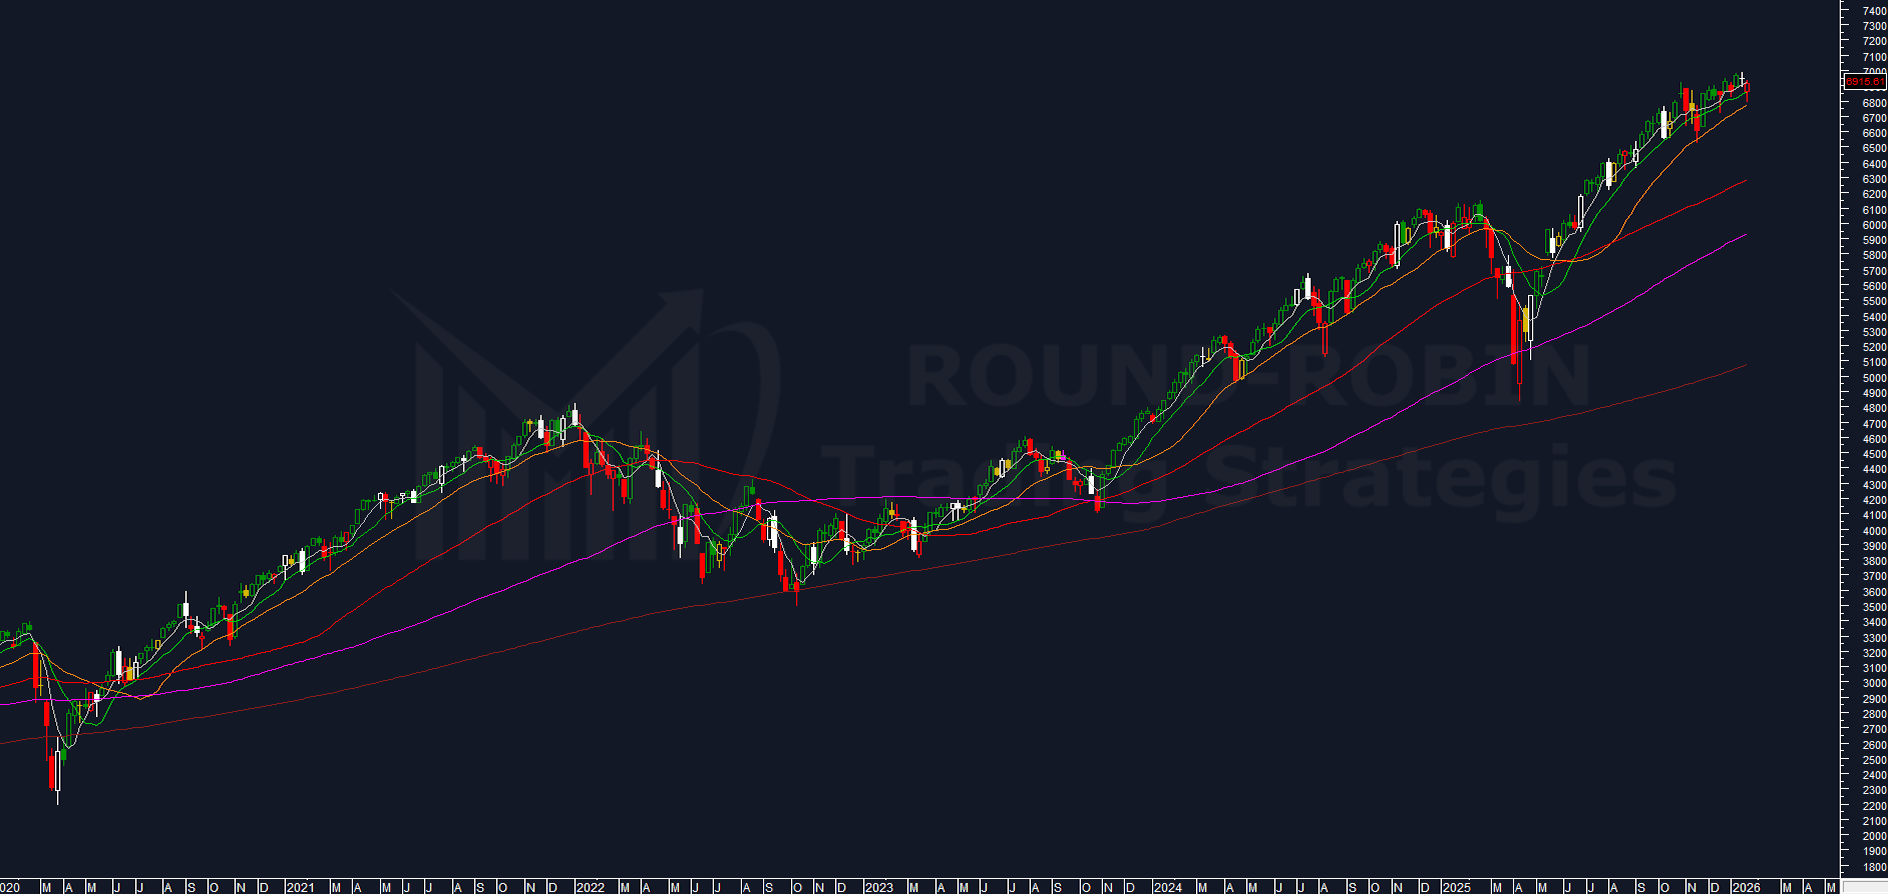
chart: S&P500 weekly
All the moving averages still show positive inclination and remain correctly aligned one below the other, from the fastest (MA5W) to the slowest (MA200W). Prices sit a few points below the MA5W — just noise, not a short-term price signal.
The Framework: MA20W and MA200W
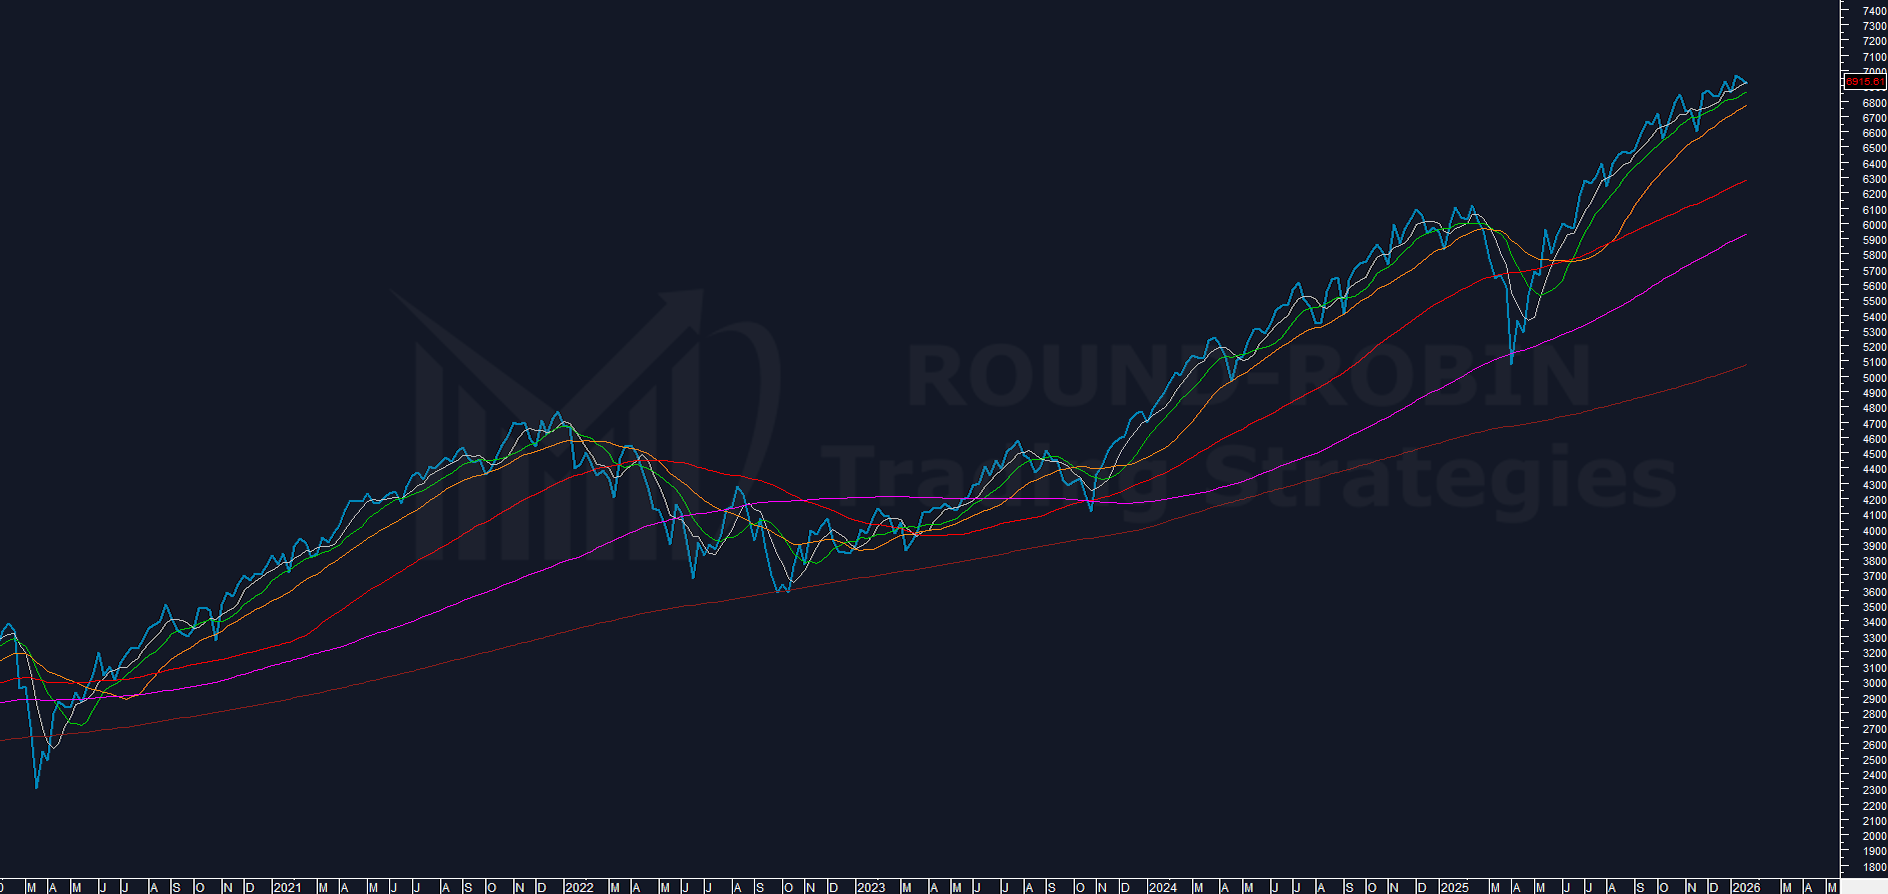
chart: S&P500 closes with MA20W
Two weeks ago, I proposed a simple theory: only the MA20W counts as reversal support. You can read the full analysis here.
This week confirmed it. The MA20W sits at 6,754. The market set its low at 6,789.05 — exactly 35 points above (+0.52%) — then ripped back up almost +2%.
We saw identical behavior in November: touch on MA20W, immediate bounce.
The rule remains simple: above MA20W, it’s bull. Below MA20W, it’s bear — unless it flattens and gets broken without movement, but we’re not there yet.
Bullish Overextension on MA200W
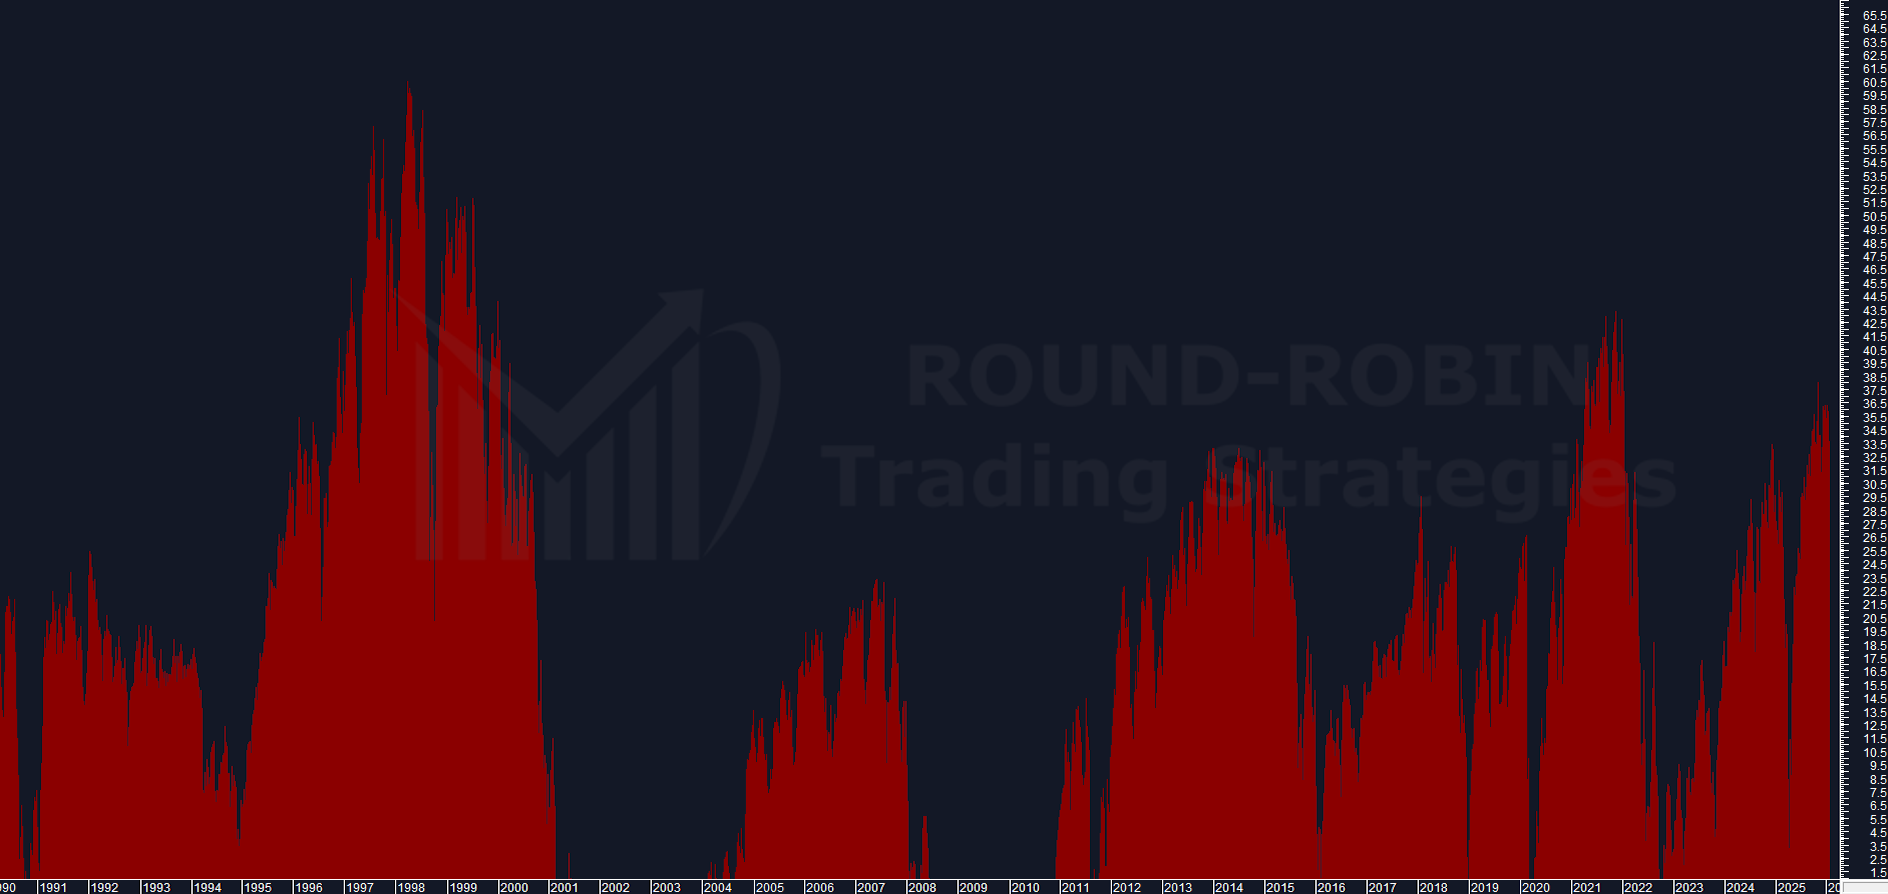
Chart: S&P 500 overextensions above MA200W
Why monitor this? Because it’s statistically relevant, as shown in our previous analysis.
Two weeks ago, the key reading was: “it does suggest we probably won’t see dramatic upside rips from here.”
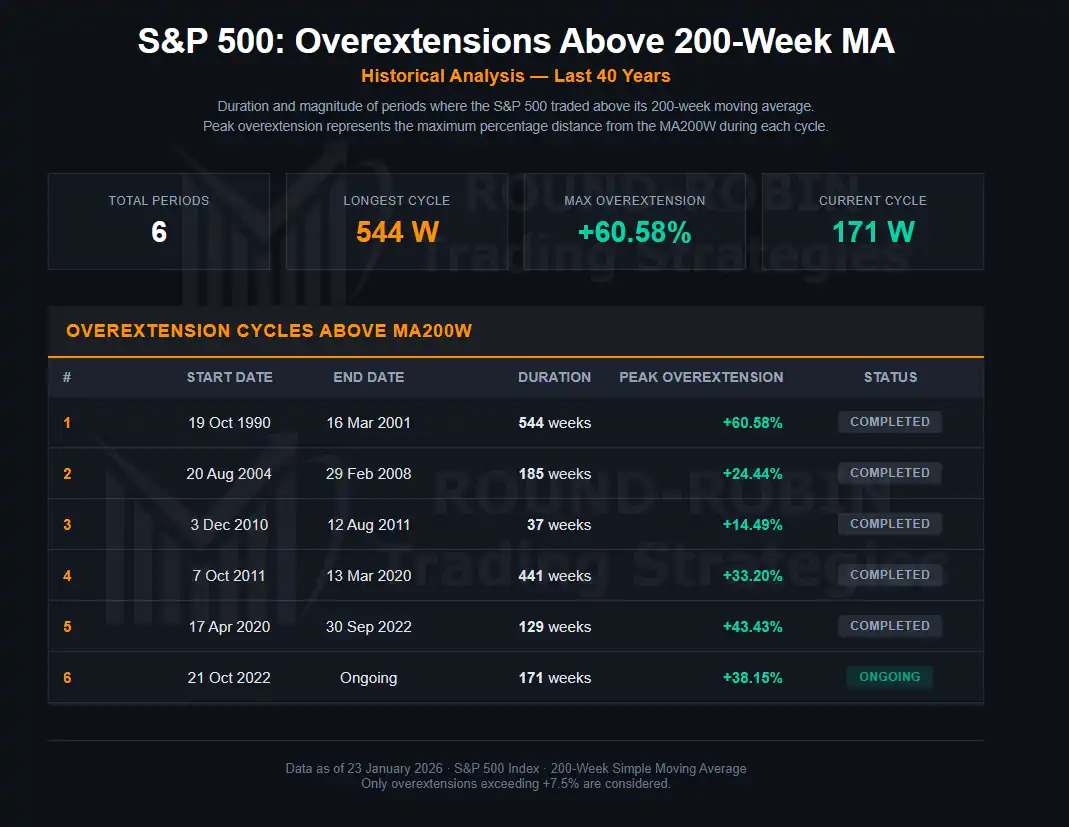
Table: S&P 500 Overextension Cycles Above MA200W
The update: S&P 500 is now 171 weeks into the current overextension cycle above MA200W. This week the extension reduced slightly to +33.74% — still historically extreme.
Conclusion
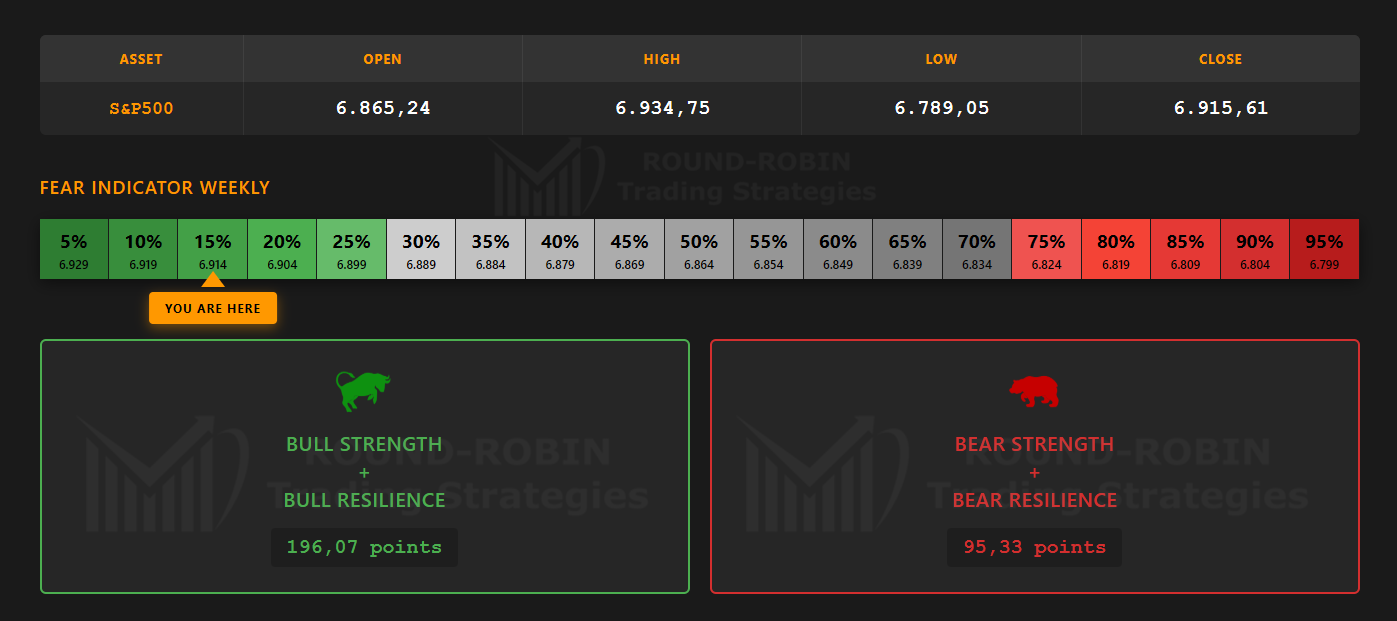
infographic: S&P500 Bulls vs Bears Weekly
Close to close, bears won the week (-0.42%). But open to close, bulls won — the weekly candle structure favors them despite the percentage loss.
Fear spiked Tuesday morning, then evaporated. Back to the green zone — almost zero worry.
Bulls remain in control. The market is respecting MA20W. Bears need to break it to change anything.
No price reversal signal yet. MA20W holds bullish. Overextension on MA200W remains toppish. These are the only data points that matter for this framework.
Two weeks ago: watch MA20W. This week: MA20W worked. The trend hasn’t changed.
Leave a Reply