


Weekly tracking of the Italian benchmark index. Why do we do this?
Check out our strategy page.
My proprietary DBBT indicator identifies misalignments between current price and expected technical levels on major indices. Every week, we put the FTSE MIB in our crosshairs.
The hunt is on.
The Big Picture
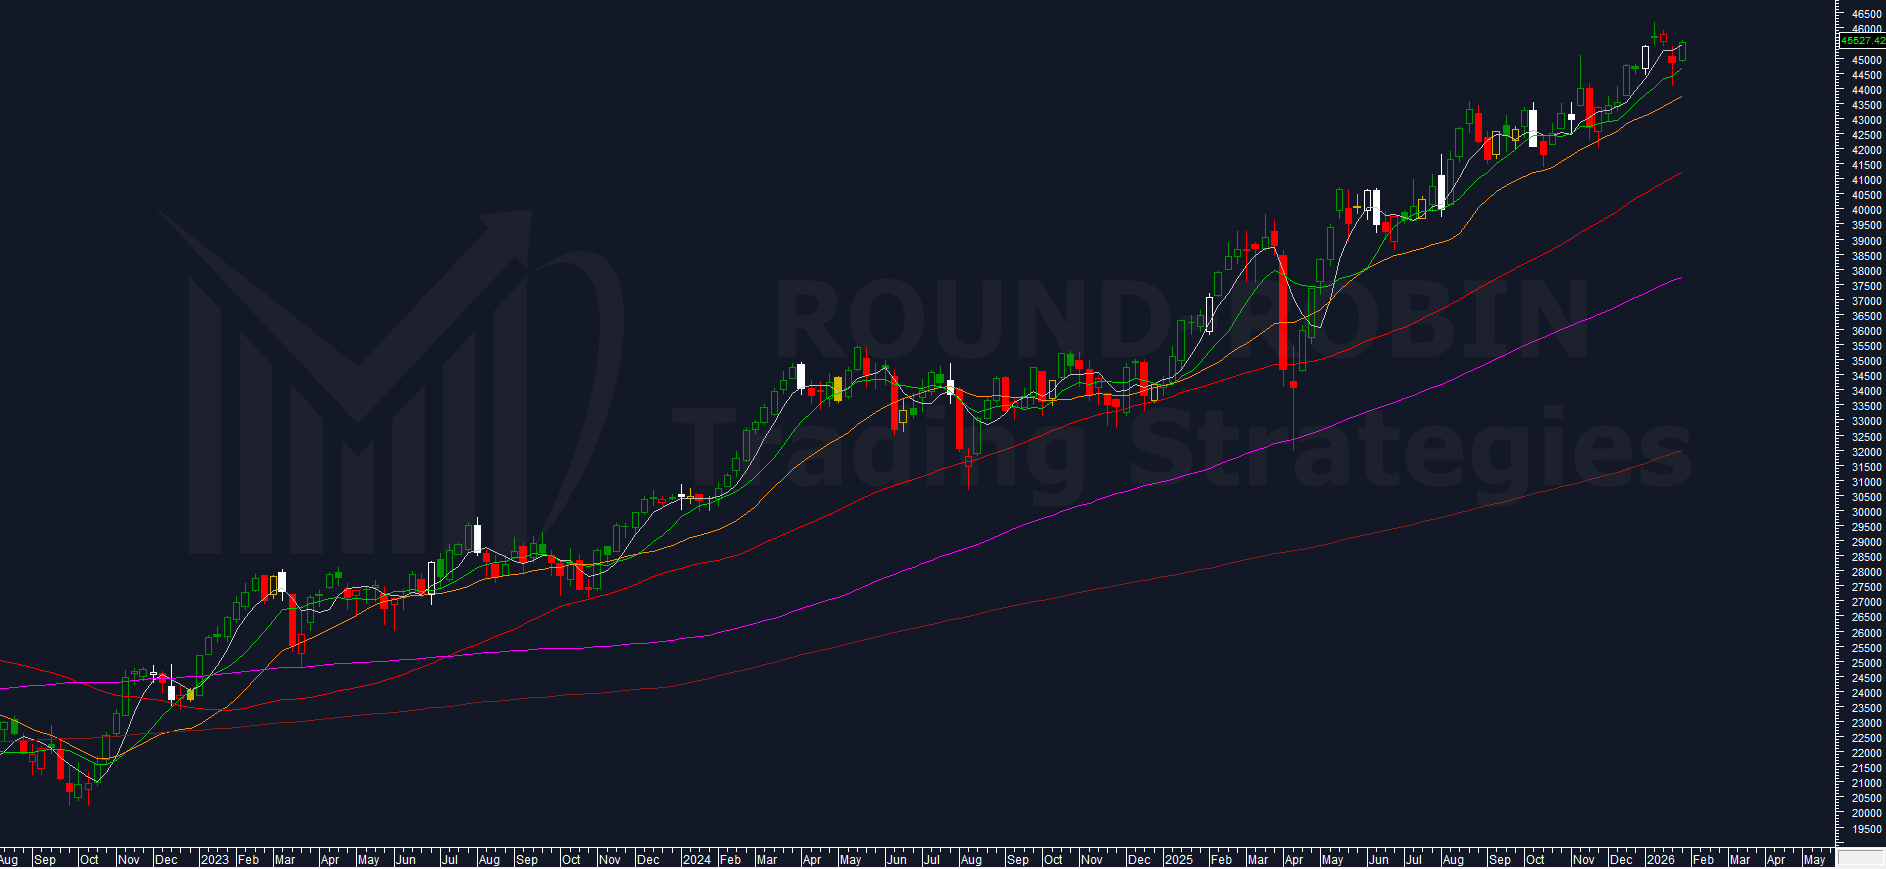
chart: FTSE MIB weekly
Another week passed without significant price variation: the FTSE MIB closes at 45,527.42 with an increase of +1.55% compared to the previous Friday.
The moving averages remain positively inclined and still perfectly aligned one below the other from the MA5W to the MA200W. With Friday’s acceleration (+1.00%) the close recovered the MA5W, but even in this case it’s just noise: the MA5W is unable to give any trend signal or even trading signal at this moment.
The FTSE MIB closes the week with higher highs and higher lows (green candle on our chart). Without a real price signal, but confirming what we had highlighted in the previous episode: this market after 2 reds — two consecutive weeks with lower highs and lower lows — is destined to bounce.
The pattern confirms itself for the fourth consecutive time. Statistically relevant? Yes. Guarantee for the future? No. But ignoring it would be imprudent.
We are now at the fifth week of lateral compression. Prices are substantially stuck at the same levels as three, four and five weeks ago. The market hasn’t moved, but something beneath the surface is happening.
Weekly % Range
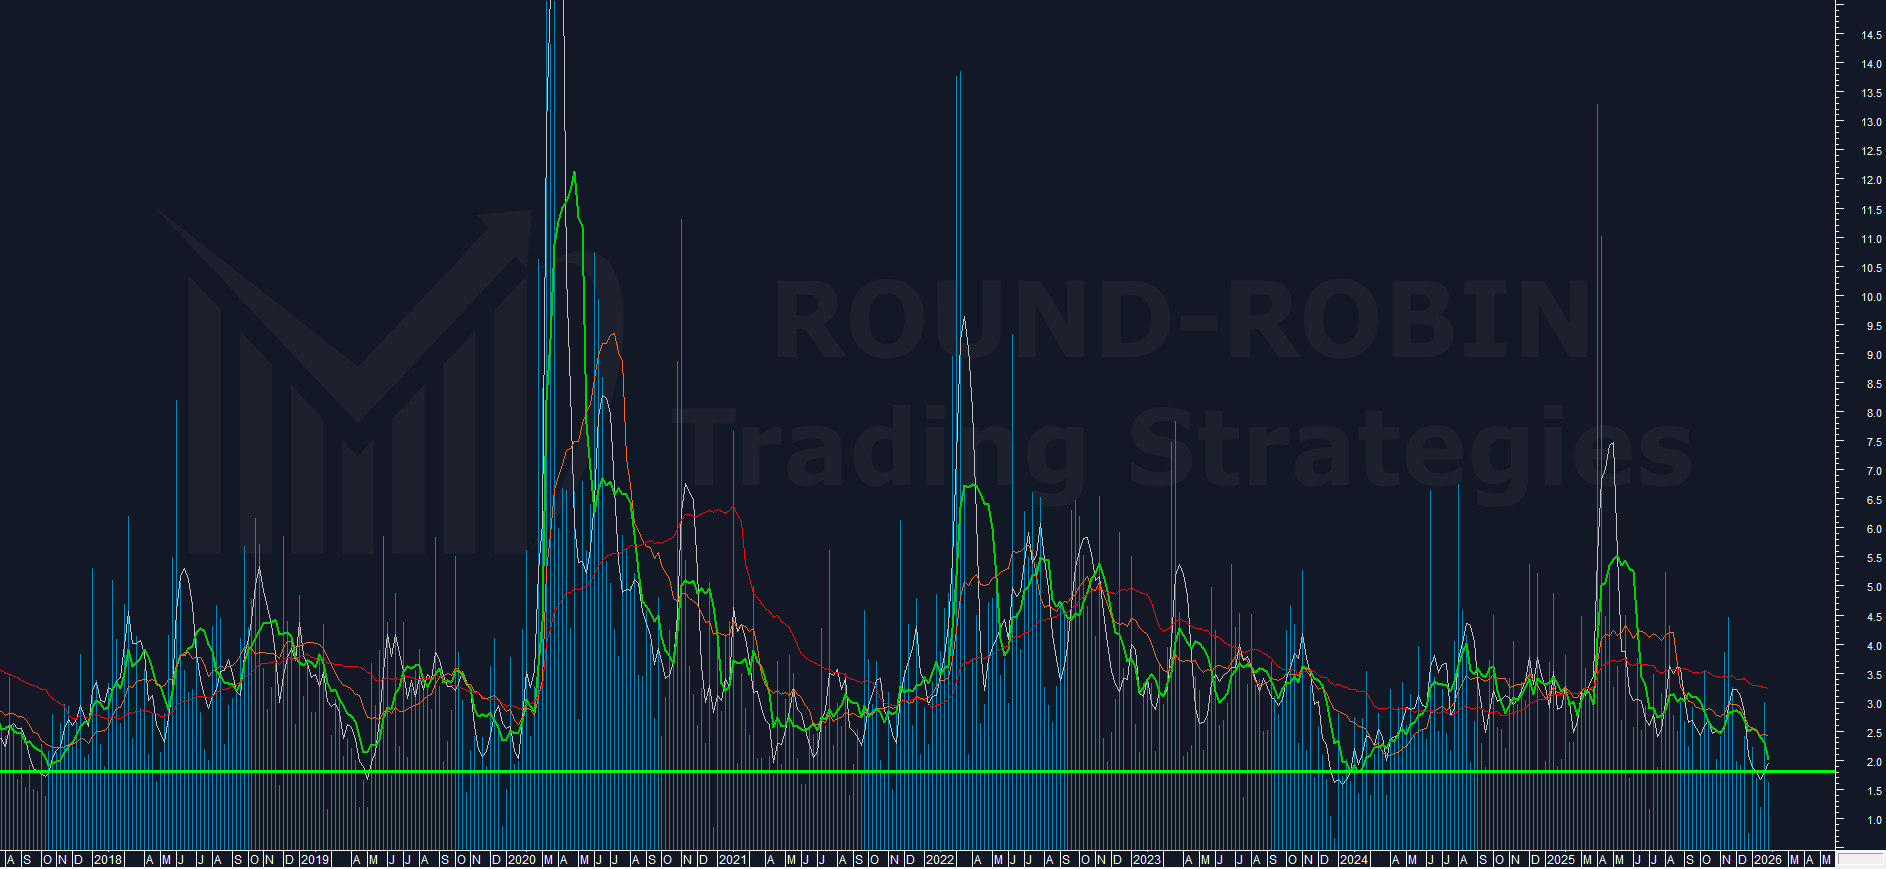
chart: FTSE MIB Range Weekly %
The indicator chart shows us how once again the weekly candle range was really very small. But it’s the 10-week moving average applied to the indicator that tells the most interesting story.
The MA10W is plummeting toward historical values — spanning two decades — from which the range has always rebounded. Money must somehow start flowing again.
In detail: we are with the 10-week moving average of the weekly % range at 2.02%, close to the minimum of February 2024 (1.80%) and below the minimum of December 2019 (2.35%).
What happened?
I think we all remember what happened after December 2019: the market dropped violently in the following months. In February 2024, instead, a rally started from the 30,000 area that ended four months later in the 35,500 area.
Opposite directions, but one common element: in both cases the market moved forcefully after reaching these extreme compression levels.
As in previous analyses: we don’t know which way, but we know there’s a very high probability that we’ll have a significant movement.
The Compression
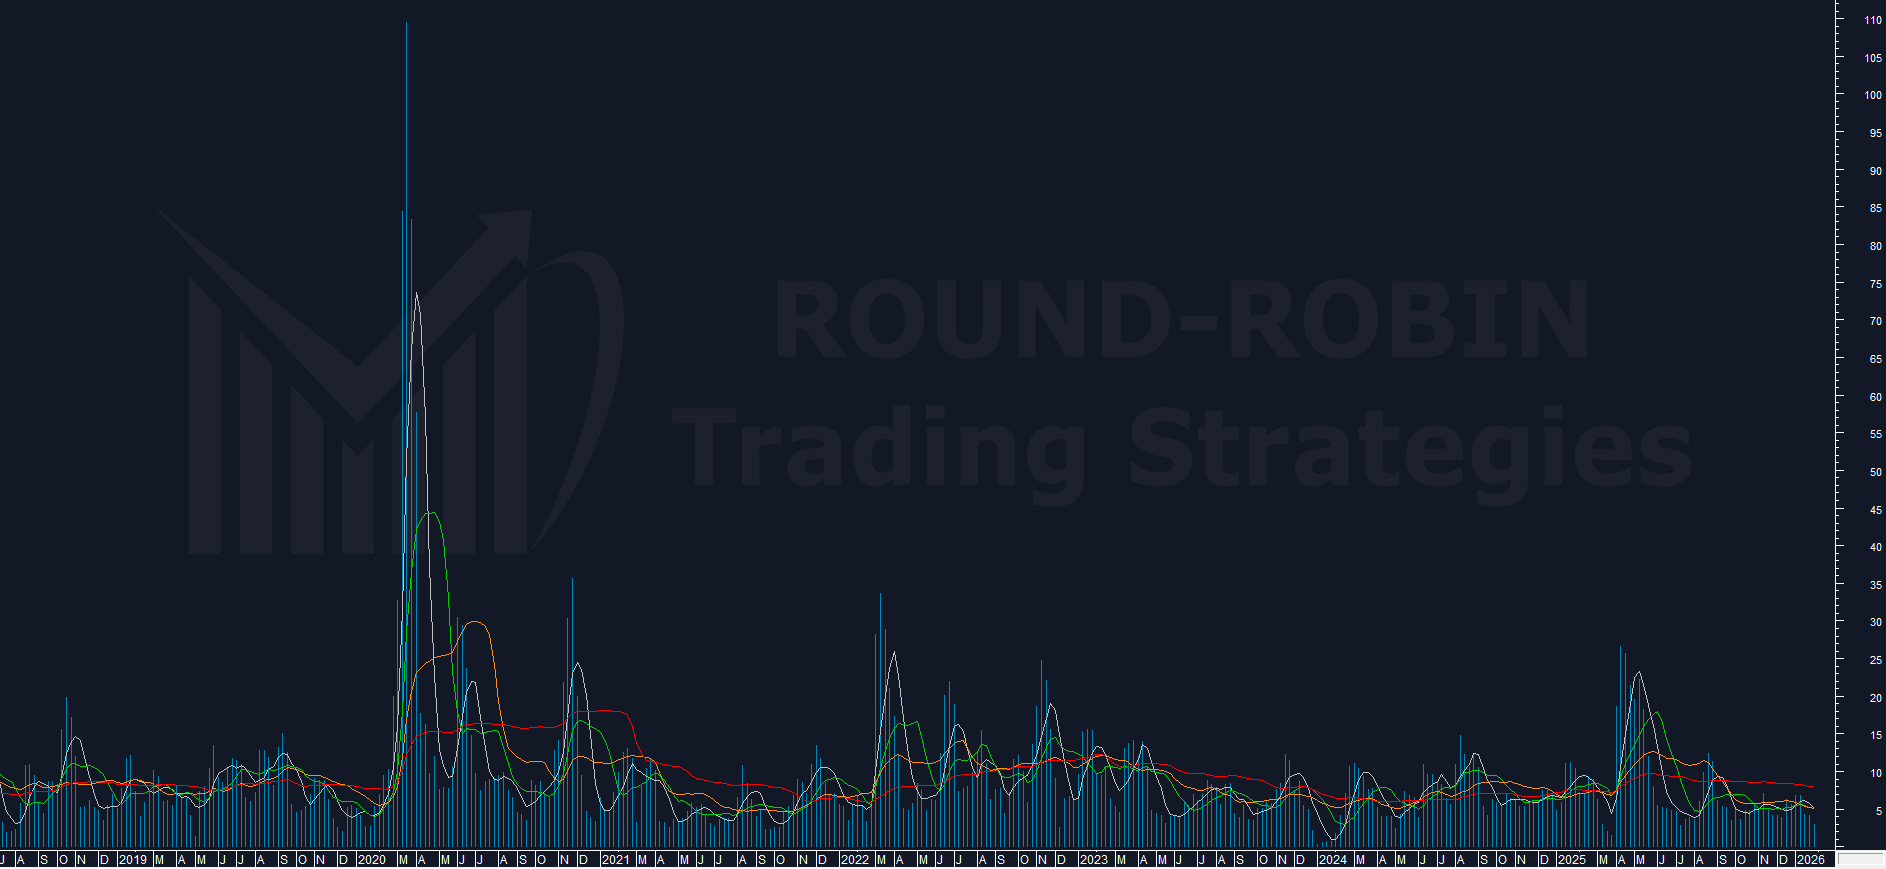
chart: proprietary volatility indicator weekly
My proprietary volatility indicator on the FTSE MIB is at its third consecutive week of decline: we’re now at 3.06%.
From the first analysis (4.41%) to the second (4.26%) to this week (3.06%), compression has intensified week after week. The moving average on the indicator is still “high” but compatible with the expectation of another 2 weeks that has been mentioned multiple times in previous analyses.
The probabilities of a movement before the technical expiration of February 20 were and remain high.
Options strategies that buy volatility — like those we talked about in previous weeks (long straddle, long strangle, iron condor) — should allow us to exploit the explosion of compression.
Conclusion
Still no signal regarding direction. The only possible deduction is to apply trend following: now it’s bull and until proven otherwise it will remain bull.
I prefer to stick to the data leaving opinions aside: it’s definitely bull, we have a statistically high probability of a directional movement, but we have no price signals.
From a strategic perspective, the situation is clear:
Either buy volatility, or wait for the signal.
The historical comparison with December 2019 and February 2024 is not a trivial detail. The MA10W of the weekly range at 2.02% tells us we’re in extreme territory.
The compression at 3.06%, the third consecutive week of decline, confirms that the spring is loading up more and more.
We have the historical data, we have the technical signals. Only the direction is missing. And we’ll know that when the market decides to move.
Leave a Reply