LOGIN SIGNUP
English Italiano
Markets
World Indices
Forex
Commodities
Crypto
EN
IT
×

CONTACT US

Round-Robin Logo

The Hunt: FTSE MIB Week 15

Weekly monitoring of the Italian benchmark index.

Why do we do this?

Check out our strategy page.


My proprietary DBBT indicator identifies misalignments between current price and expected technical level on major indices.

Every week, the FTSE MIB is in our crosshairs.

The hunt is on.


The rally is not slowing down.

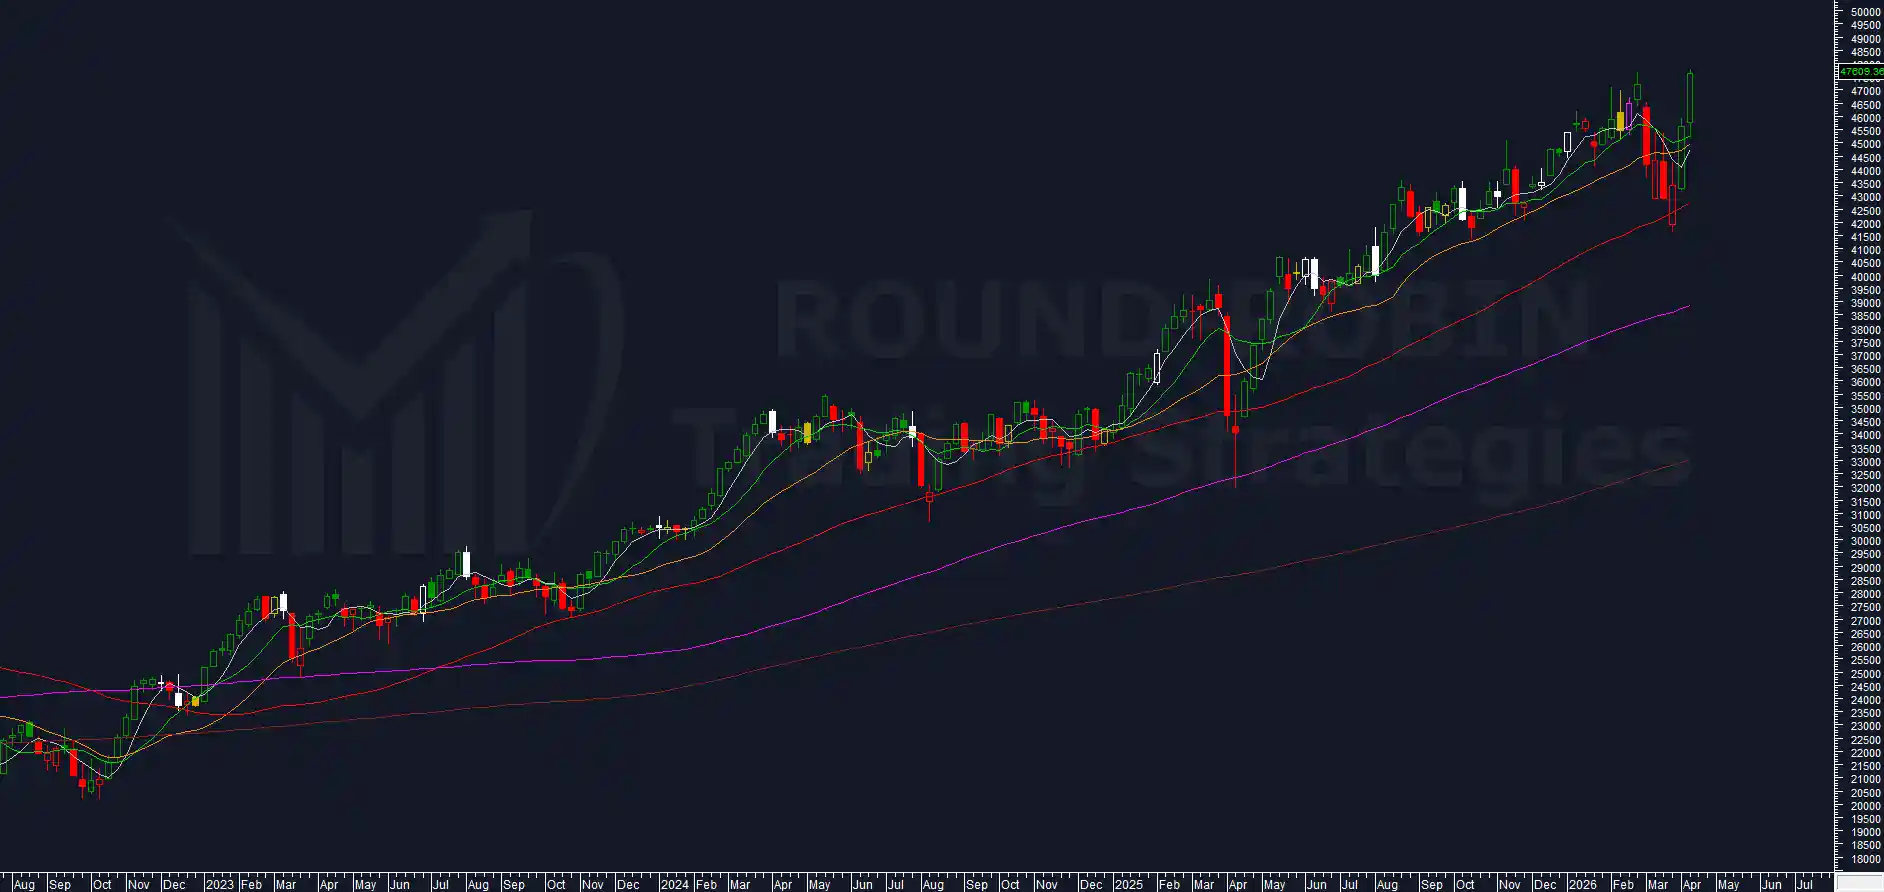
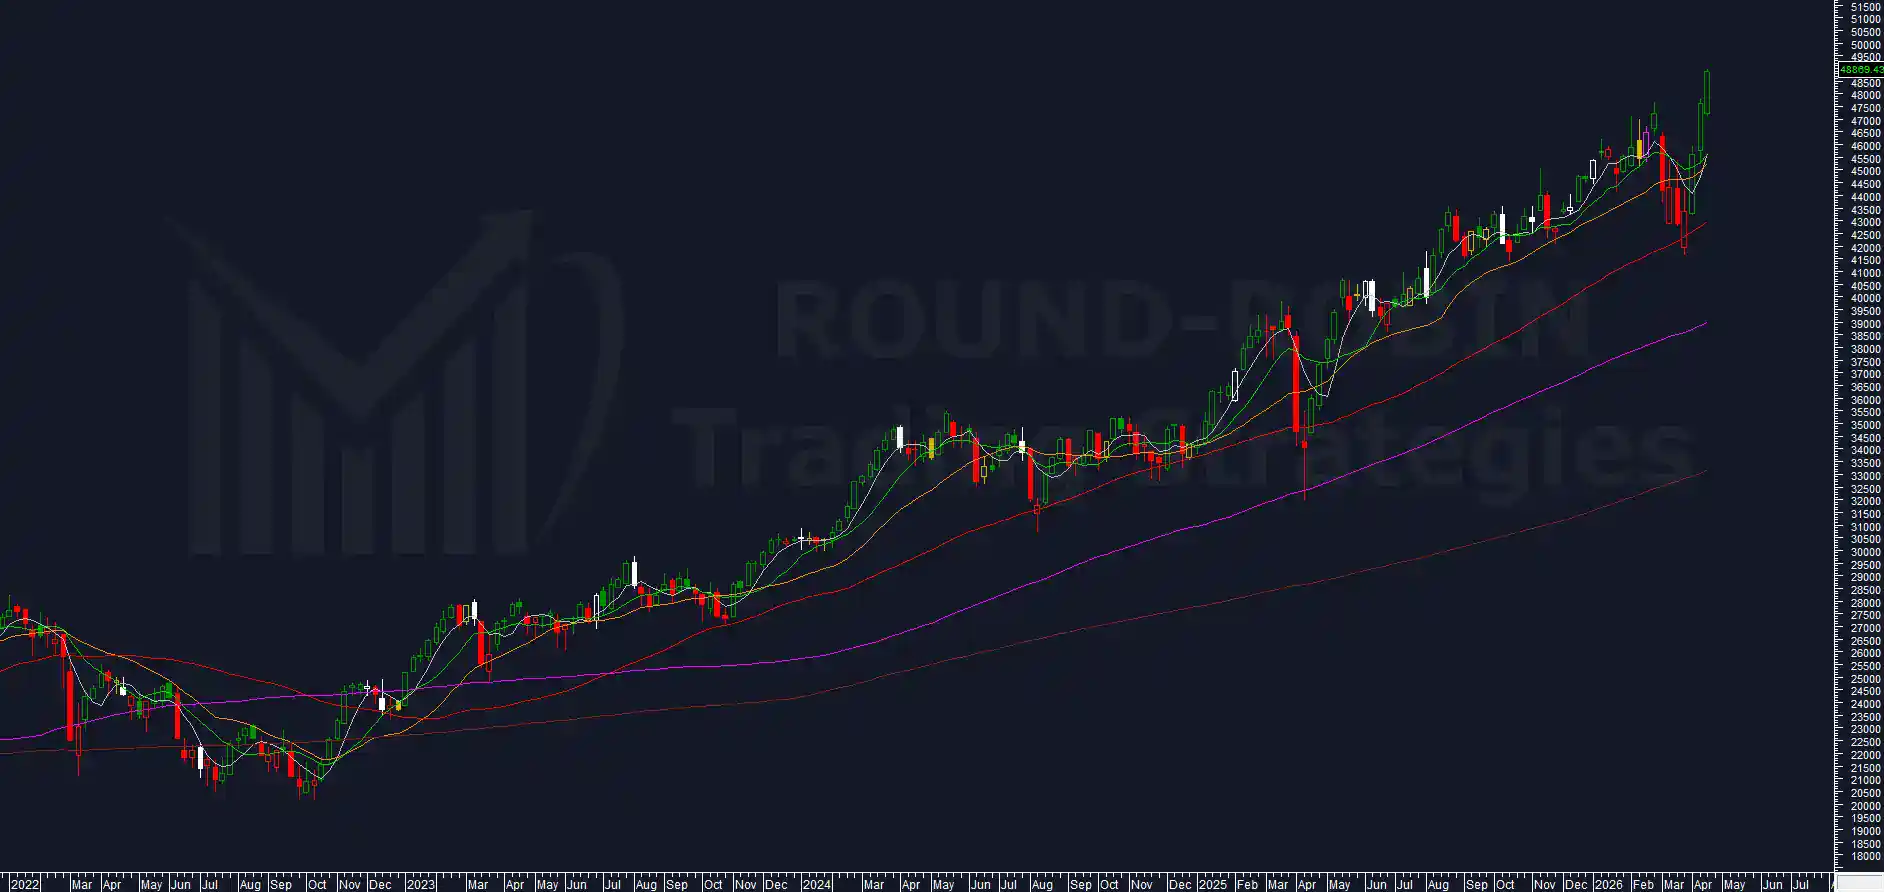
The FTSE MIB closes the week at 48,869.43, a new multi-year closing high, with a high of 48,957.89 also a record. Roughly 1,260 points above last week’s close.

In our latest analysis we flagged potentially toppish conditions and the system had gone flat.

The market responded with yet another strong rally week, the third consecutive one with higher highs and higher lows.

As always, let’s dig into what happened and what the numbers are telling us. [...]

Read More →

Chart of the Week: Eurostoxx50

Your weekly appointment with the world’s most followed charts.

This week we chose the Eurostoxx 50 as Chart of the Week not because it stood out particularly, but due to the lack of actionable setups from the other assets we follow. Gold and Silver stalling, DAX, FTSE MIB and S&P 500 flat.

The Eurostoxx 50 comes into play as it approaches a long signal, having shown more momentum than the DAX and stronger relative strength.

A configuration that, while not explosive, deserves a closer look.

Let’s see what the charts tell us. [...]

Read More →

Charts Flash: Week 15/2026

Quick observations on the charts that caught our eye this week.


This week’s flash covers EUR/USD, Brent Crude Oil, Bitcoin, S&P 500, DAX and Nikkei 225. Gold and Silver remain flat with no relevant changes and are not updated. EUR/USD prints a large bullish candle clearing the MA50W, MA10W and MA20W in one shot. Brent is violently rejected from the weekly high with the range back above 23%, closing near the MA10W. Bitcoin moves back above the MA10W with the cross on the MA20W, but the range remains tight: the compression continues. The S&P 500 produced a textbook swing from the MA50W closing above the MA20W, recovering in one week the negativity of the previous three. The DAX loses momentum after the rally from the MA100W. The Nikkei 225 explodes with a massive bullish candle, comfortably surpassing the target from our Chart of the Week last week: all-time highs are now in sight.

Let’s go into a bit more detail and try to figure out what lies ahead for next week. [...]

Read More →

The Hunt: FTSE MIB Week 14

Weekly monitoring of the Italian benchmark index.

Why do we do this?

Check out our strategy page.


My proprietary DBBT indicator identifies misalignments between current price and expected technical level on major indices.

Every week, the FTSE MIB is in our crosshairs.

The hunt is on.


Another short week, another bull run.

The FTSE MIB posts a new closing high for 2026 at 47,609.36.
The market seems to be back to shrugging off the real or perceived dangers of the war in Iran, every day everything and its opposite is said and we are back to good news is good news and bad news is good news.
The weekly high at 47,770.38 surpasses the previous top at 47,650.97 but the market fails to close above it.
Let’s try to understand if this is just a coincidence or if at these levels prices are starting to look a bit stretched. [...]

Read More →

The Hunt: FTSE MIB Week 13

Weekly monitoring of the Italian benchmark index.

Why do we do this?

Check our strategy page.


My proprietary DBBT indicator identifies misalignments between the current price and the expected technical level on major indices.

Every week, the FTSE MIB is in our crosshairs.

The hunt is open.


Last week we left the FTSE MIB in a neutral stance, with shorts closed and a loss of bearish momentum still to be confirmed.

The confirmation came. In spectacular fashion.

A short week due to the Easter holidays, just 4 sessions with Friday closed. The new week reopens on Tuesday after the Easter Monday closure.

In just 4 days the market produced a bullish candle with a massive body that historically has almost always completely changed the short-term technical structure. [...]

Read More →

Chart of the Week: Nikkei225

Weekly appointment with the most followed charts in the world.

In early March we chose the Nikkei 225 as Chart of the Week to build a bearish case. The overextension on the MA200W had just set a new all-time record at 57.39%, and we wrote that the return below 50% was not a matter of “if” but “when”.

We also wrote something else: once the excesses are exhausted and the overextension falls back below 50%, the index has historically resumed its rise. We called it “the most important trading window”.

That window is opening now.

The Nikkei 225 closed this week at 53,123.49. From the record close at 58,850.27 the index has dropped 14.08% to its low at 50,558.91, completing the first leg of the correction we had anticipated.

Let’s see what the charts are telling us. [...]

Read More →

Charts Flash: Week 14/2026

Quick observations on the charts that caught our eye this week.


This week’s flash covers EUR/USD, Brent Crude Oil, Gold, Silver, Bitcoin, S&P 500 and DAX. EUR/USD at its third consecutive week of testing and rejection from the MA50W, the attempt to recover the MA5W failed, the short remains intact. Brent, featured in our Chart of the Week last week, continues as an inside candle with volatility and range declining sharply but still elevated: the system remains short. Gold and Silver stay neutral, both with rising highs and lows but without a weekly price signal to justify re-entry. Bitcoin unchanged, compressed below the MA10W for the third consecutive week with a sharply contracting range. The S&P 500 closes short positions on loss of momentum, simultaneously recovering the MA50W and MA5W with one of the most extended bullish bodies in a year. The DAX confirms the long with nearly +900 points on the week, rising highs and lows and recovery of the MA5W. [...]

Read More →

Chart of the Week: Brent Crude Oil

Weekly appointment with the most followed charts in the world.

Last week we identified the setup and defined the two possible triggers: a bull trap above 119.13 or a direct rejection from the 112.19-119.50 area with a weekly close below 106.

The trigger has fired.

On Monday March 23, with Brent still above 114, Trump announced the suspension of attacks on Iranian energy infrastructure and the start of negotiations. The drop was immediate: within minutes the front month lost over 13%, pushing prices down to 93.45. Iran later denied the existence of any talks, and the market recovered part of the lost ground. All of this in a context already made chaotic by the contract rollover.

The selloff was followed by a recovery, but the recovery did not change the structure. At the weekly close Brent settled at 105.32: it bounced off the lows but failed to reclaim the supply area.

The short signal was generated at Friday’s close. Let’s see what the charts are telling us. [...]

Read More →

Charts Flash: Week 13/2026

Quick observations on the charts that caught our eye this week.


This week's flash covers EUR/USD, Gold, Silver, Bitcoin, S&P 500 and DAX, a new addition. EUR/USD triggered a new short entry: the RJFP pattern has appeared for the first time since the late-2024 downtrend. Gold and Silver exited shorts on loss of bearish momentum and a record volatility spike, the highest our proprietary indicator has recorded since 2008. Bitcoin short remains intact inside a lateral range. The S&P 500 survived the week as an inside candle until Friday's crash broke the MA50W cleanly, surpassing the first target. DAX opens its first long trade of the year with a near-perfect reaction off the MA100W.

Read More →

The Hunt: FTSE MIB Week 12

Weekly monitoring of the Italian benchmark index.

Why do we do this?

Check our strategy page.


My proprietary DBBT indicator identifies misalignments between the current price and the expected technical level on major indices.

Every week, the FTSE MIB is in our crosshairs.

The hunt is open.


Last week the question was clear: what would the market do once it reached the MA50W?

The answer came at the open, with a gap down to 41,929.20 and a low at 41,616.11.

The bearish break of the MA50W was not confirmed.

The market bounced sharply, recovering up to the MA5W, which however acted as resistance.

The failure to confirm the MA50W break, combined with a loss of strength across other indicators, triggered the closure of short positions in our system.

Let's look at what the market structure is telling us from here.

Read More →