


Weekly appointment with the world’s most watched charts.
This week, the gold medal for Chart of the Week has been amply earned by Bitcoin.
Between desperate influencers preaching “the more it drops the better, smart money buys the dip,” haters who can’t wait to see BTC go to zero, we position ourselves in the middle—or rather far to the side, to avoid contamination—and try to show what the numbers say, without any bias.
We’re not fans.
We stand—we try to stand—with whoever wins.
If you’re a permabull or a permabear, don’t continue reading.
This isn’t for you.
The Big Picture
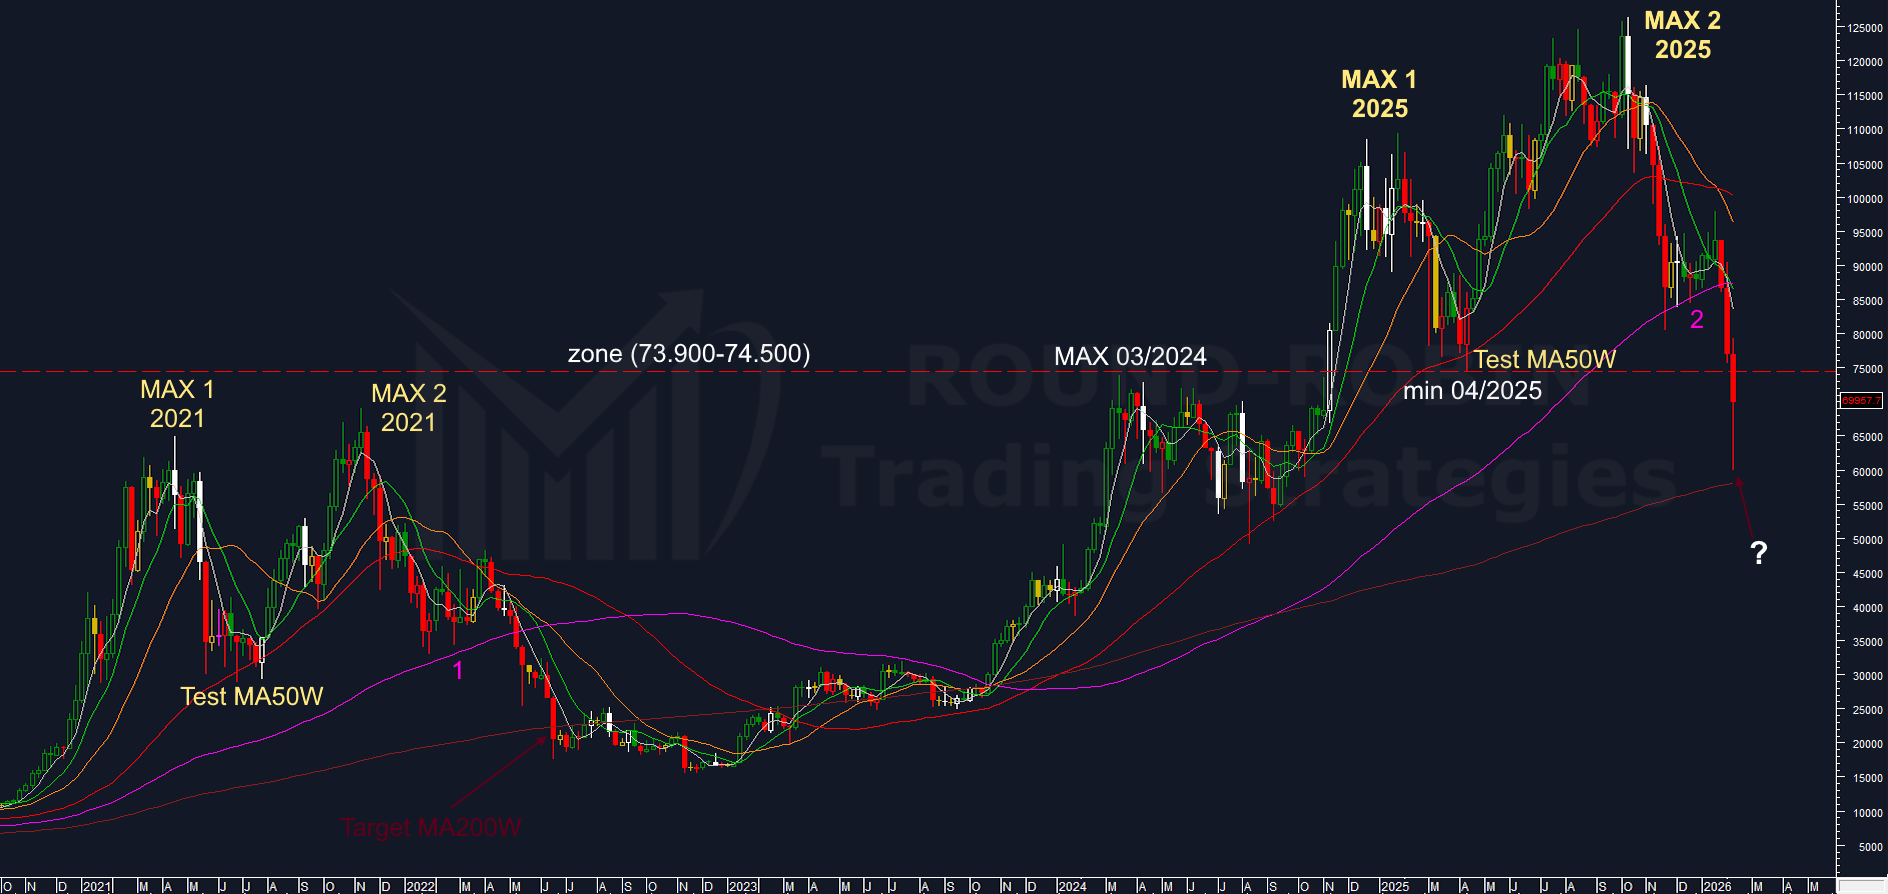
chart: Bitcoin weekly
The Bitcoin chart confirms, almost perfectl, our analysis that you can find here.
The parallel with 2022 has paid off, but now we need to manage a target problem.
In last week’s update we indicated 58,000 as the target.
We find ourselves at week’s end with Bitcoin at 70,000, after bouncing precisely from 60,000.
What to do now?
Given the minimal difference, can the signal be considered fulfilled?
Discretionally, for what my opinion is worth, I’d say no.
Because:
a) The bears overwhelmed the level where one would have expected at least a minor reaction, where the March 2024 high and April 2025 low reside. Now this zone, 74,000–75,000, could act as resistance.
b) In the 2022 crash, despite spending several months bouncing, BTC needed to create a more solid bottom to restart.
But let’s see what the data says.
Chart Analysis and Moving Averages
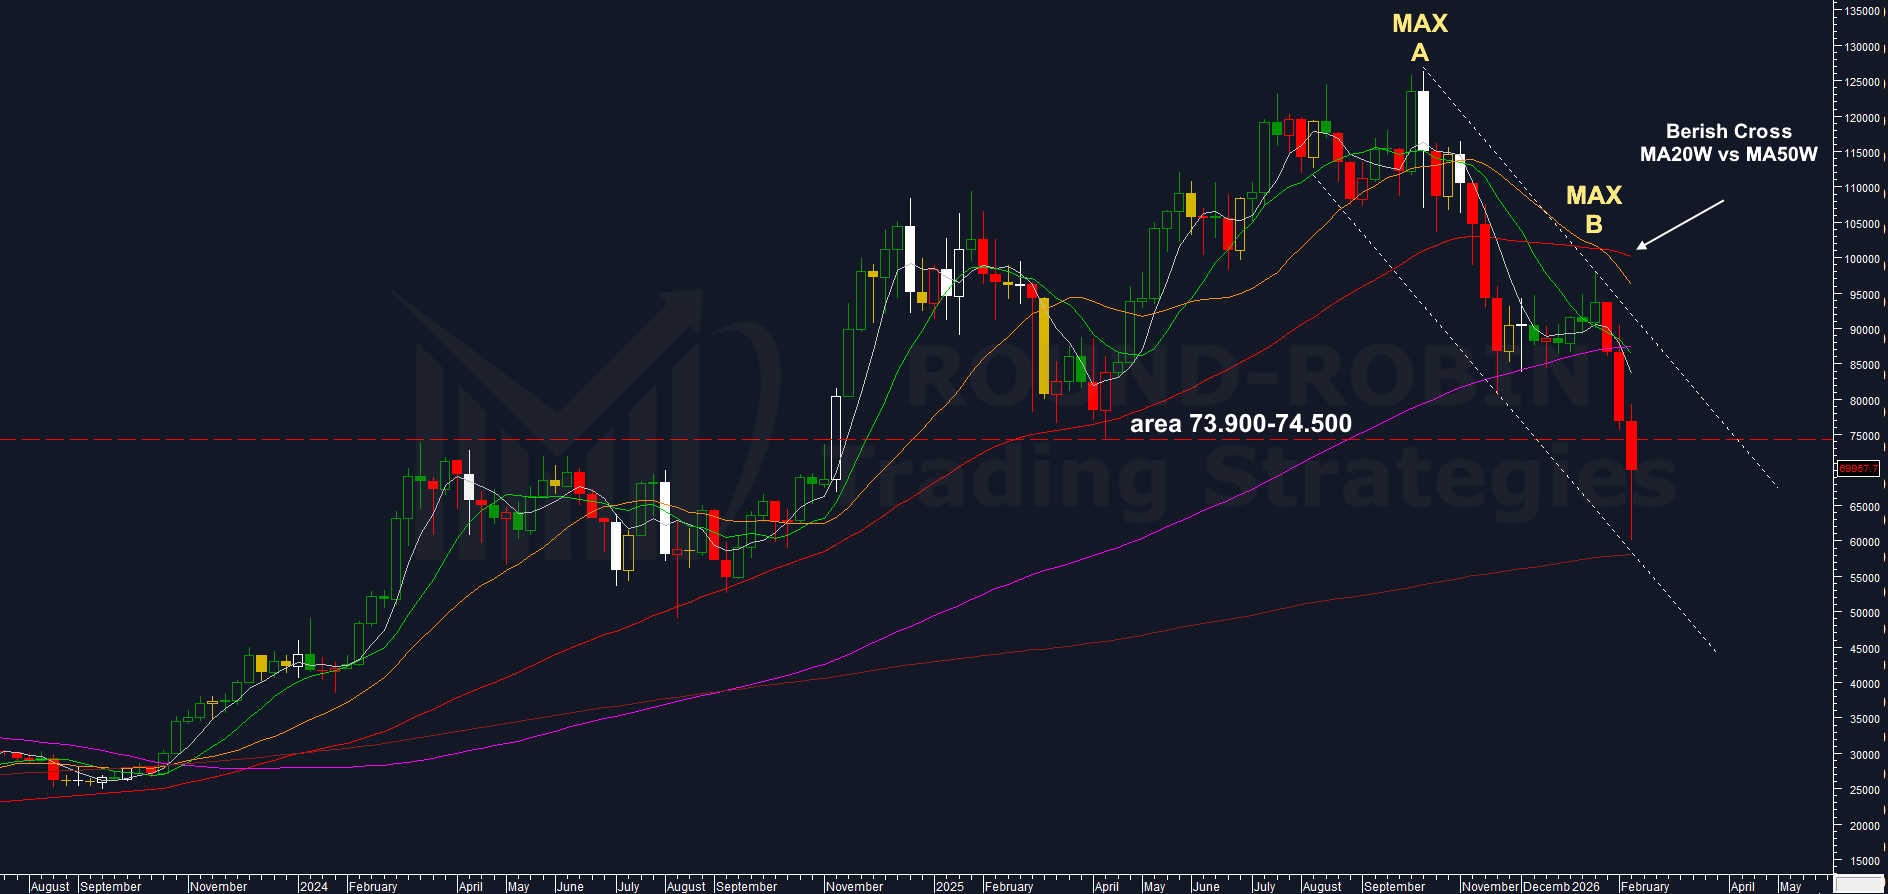
Chart: Bitcoin – bearish cross MA20W vs MA50W
In all significant BTC rallies, the bearish cross of the MA20W on the MA50W has led to more or less extended periods of bear market.
Desperate influencer’s voice: “Yeah but it always took off after! Only an ignorant person wouldn’t understand that!” (sanitized version).
True, it always came back up—but because there was a bullish signal afterward.
Can it rise on hope? We don’t think so.
Support groups saying “we’ll make it through this time too” and what we call “fantasy traders”—who draw imaginary lines on trend continuations—don’t modify the trend.
When it’s technically long, we’ll be among the first to show it.
For now it’s a bounce in a short/short-medium term bear market.
It’s called a bounce precisely because it’s in the opposite direction of the main trend.
The weekly candle is down compared to the previous one.
The lower wick is good, but it’s not identifiable as a reversal signal.
We have declining relative highs and lows.
We don’t draw random trendlines on our charts—we don’t clutter them until there are three contact points on a trend—but the slope between the October 2025 and January 2026 highs is notable.
On the chart we’ve drawn two white dashed lines exclusively to better illustrate the concept to readers, but there’s no channel with only two contact points, in our way of operating.
What could they tell us if there were a third point?
If the price touched the upper part of the hypothetical channel around 75,000 in the next two months, and if it then dropped—we have two “ifs,” we’re talking pure hypothesis—we’d have a scenario consistent with 2022: a final and stable landing on the MA200W.
For now it’s not there.
Let’s stick to what the king of cryptocurrencies has shown us.
Resistance first, support later: area 74,000–75,000.
We don’t know what it will do once it gets there, but if a bearish signal arrives from that point, it could be the real one, the one that leads to the MA200W.
Weekly Percentage Range
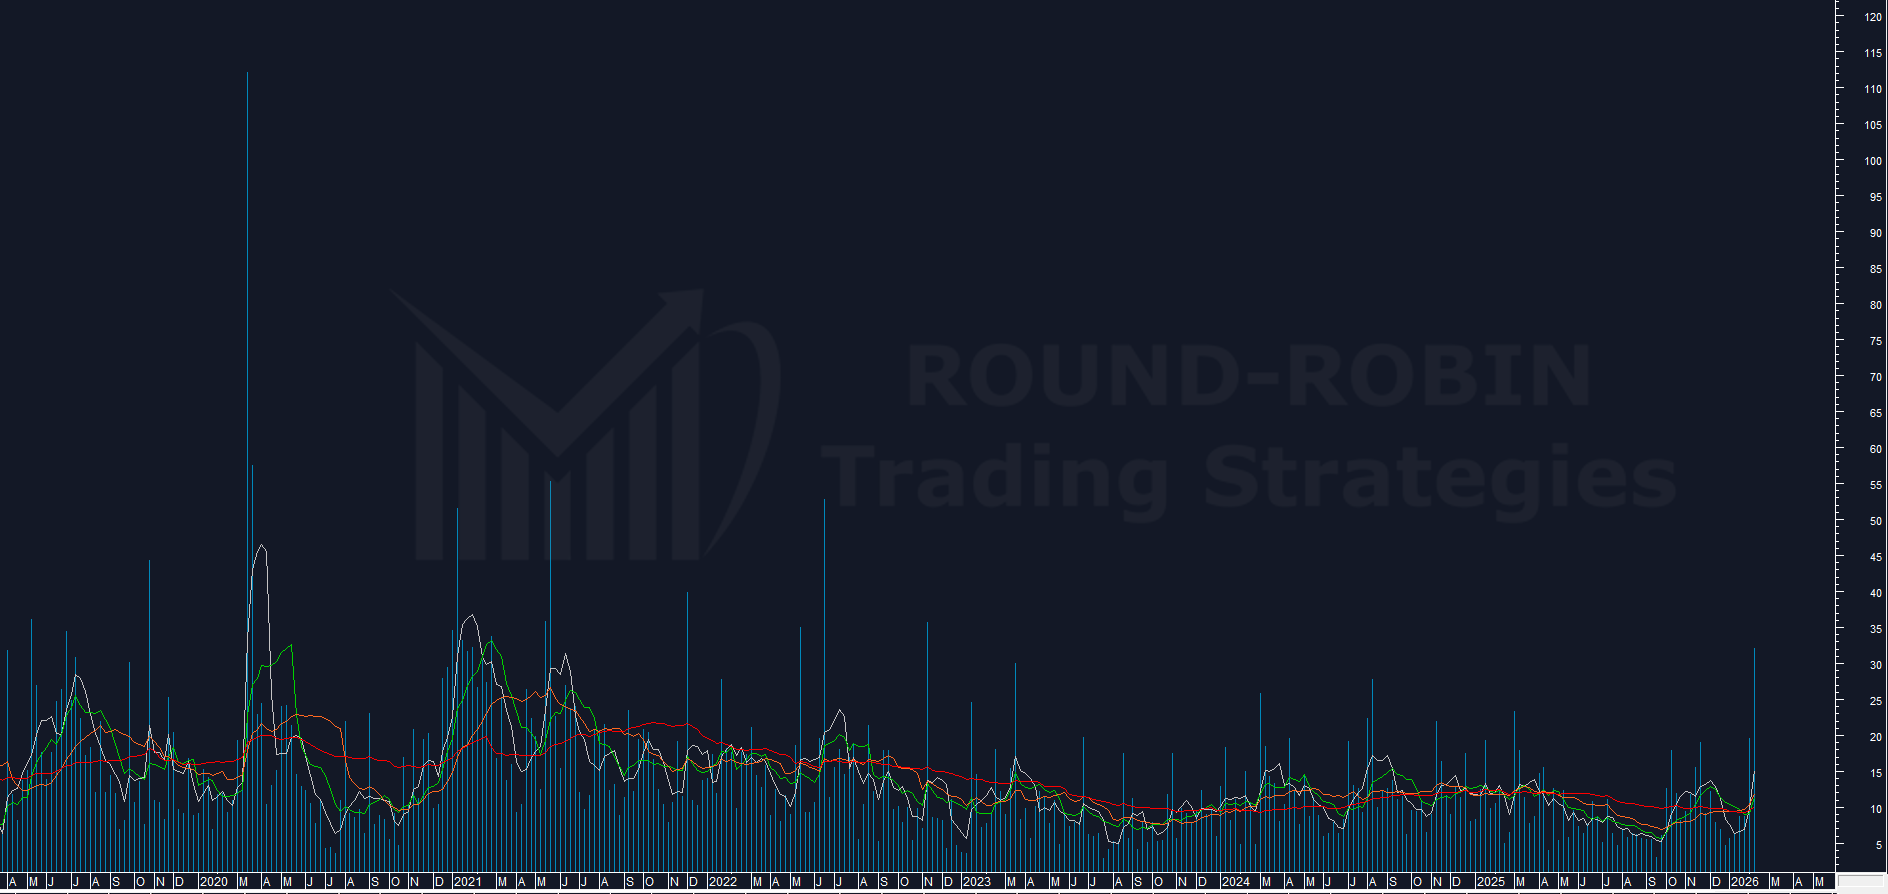
chart: Bitcoin – weekly range %
Between the week’s high and low there’s 32.22%.
Impressive?
Not really for Bitcoin.
In 2020, in the same week, it touched 3,800 and 8,200: 122%—and that’s not even the record.
Even in more recent years, in 2022, we saw 53%.
So a spike, but nothing epochal.
Let’s then take the three closest spikes—2022, 2023, 2024—and see what happened.
| Year | Post-Spike Behavior | Volatility |
|---|---|---|
| 2022 | Consolidation at the low for several weeks | Relatively low |
| 2023 | Consolidation at the low for several weeks | Relatively low |
| 2024 | Consolidation at the high for several weeks | High |
Not sufficient to assert that the spike is a knee-jerk market reaction, but it’s a clue worth following.
Volatility
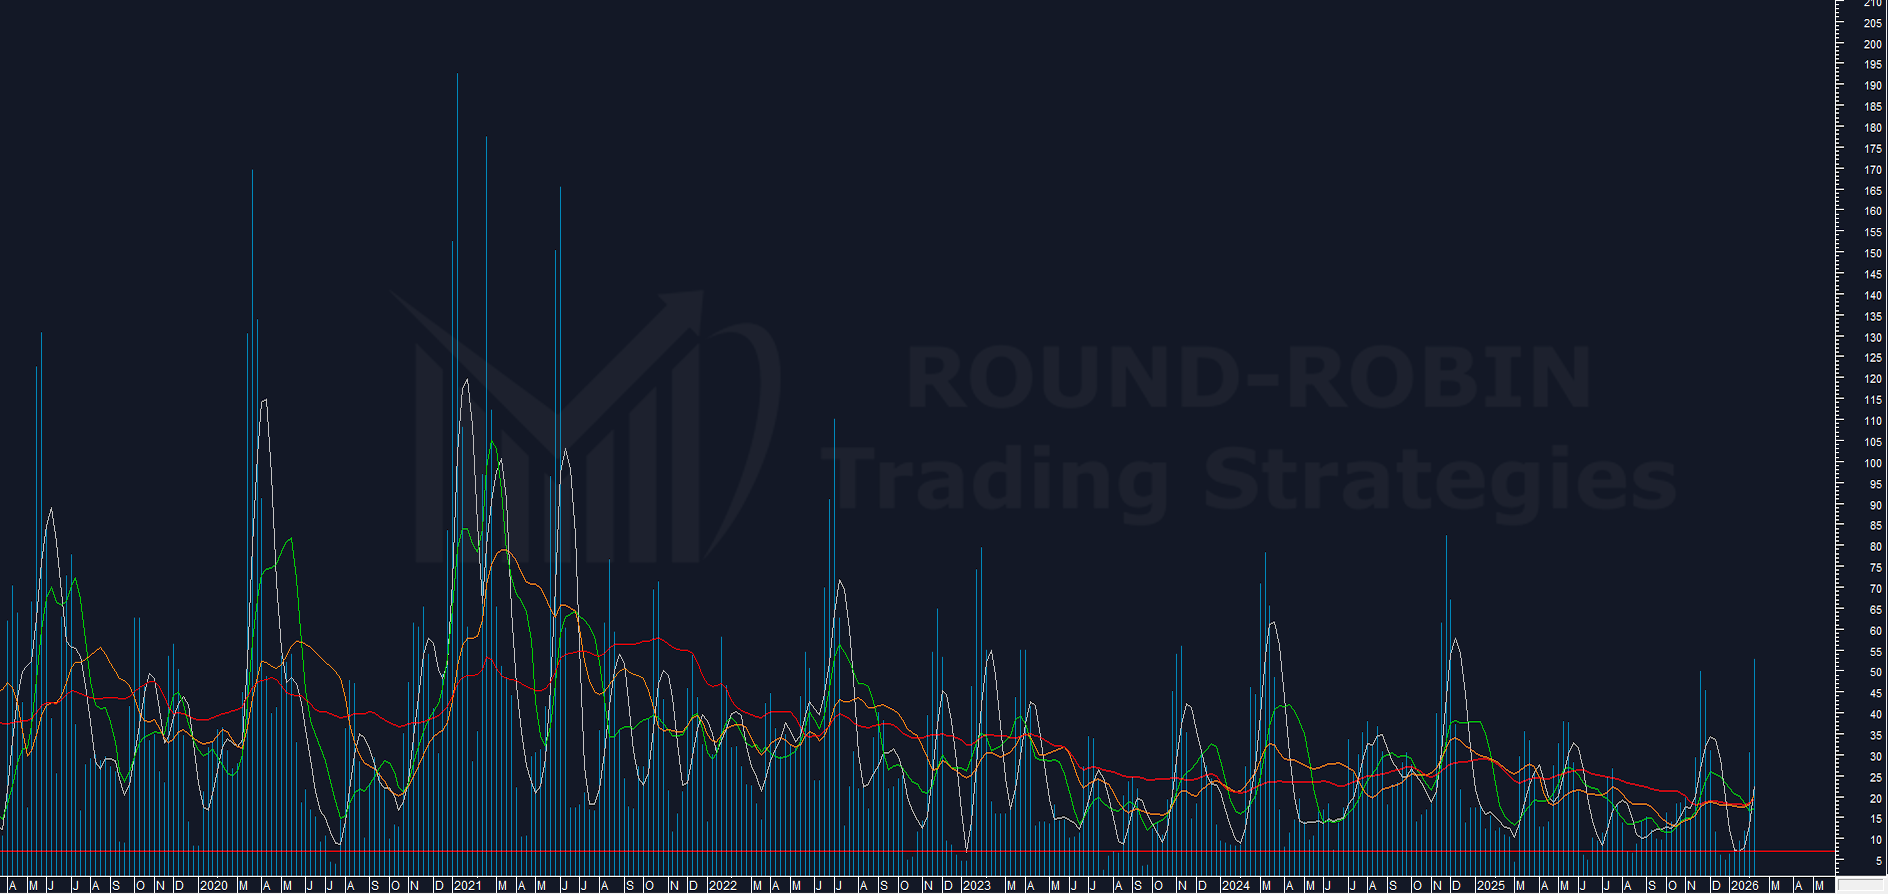
chart: Bitocin – proprietary indicator weekly
Let’s try to continue the analysis following the trace of weekly range expansion and look at volatility.
Here too we have a spike, but laughable compared to what we’ve seen in the past.
Beginner’s voice: “It’s obvious, BTC price is now 100K, how do you think it can have the same volatility as when it was at 3,000 or less?”
True, but with a note: this is typical of assets either heavily undervalued, or those without foundations.
Our proprietary volatility indicator shows how slower averages—look at the red MA50W calculated on the indicator—have followed the progressive volatility descent with price increase.
But the MA5W is far from the 2024 peaks, when BTC prices were equal to or higher than current ones.
Let’s reason in reverse.
What have the bottoms of the MA5W calculated on the indicator produced, after significant peaks (indicator >50%)?
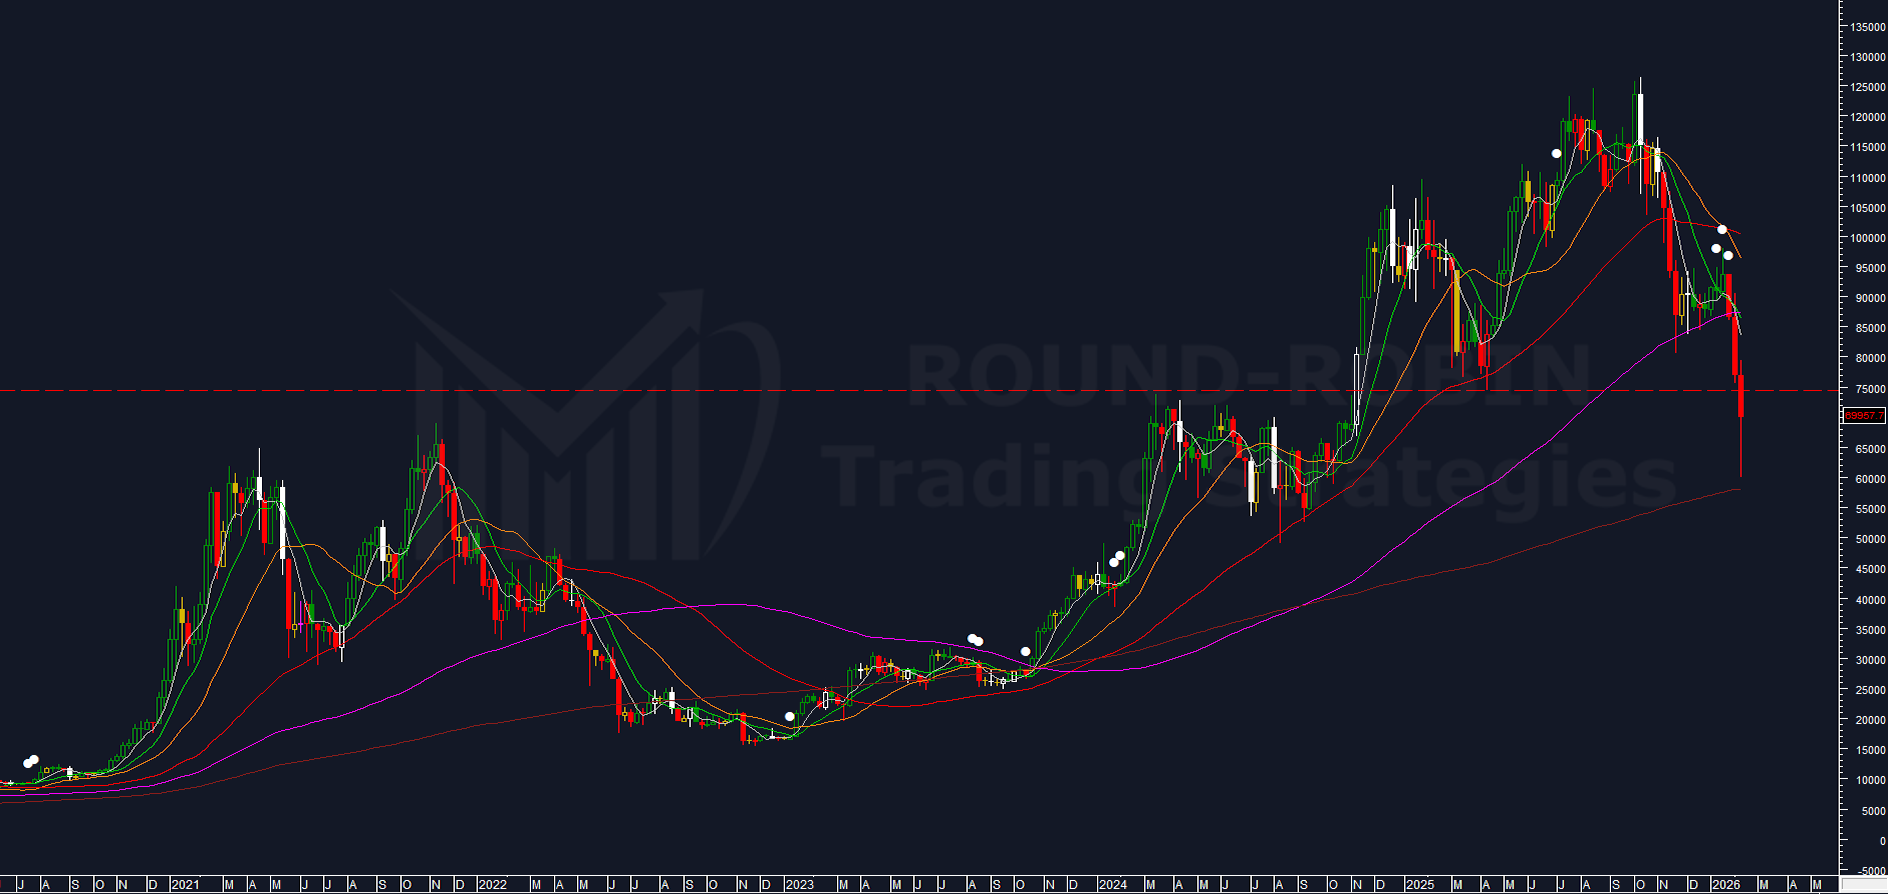
chart Bitcoin: volatility indicator MA5W extreme lows
The white dots on the chart identify these cases.
Except for one at the start of 2023—which was a bottom after a long consolidation—the others suggested a more or less pronounced continuation of the trend.
Now let’s look at the duration of these continuations.
Without going into too much detail, it’s visually clear that they have a duration exceeding the current two weeks.
Weekly RSI
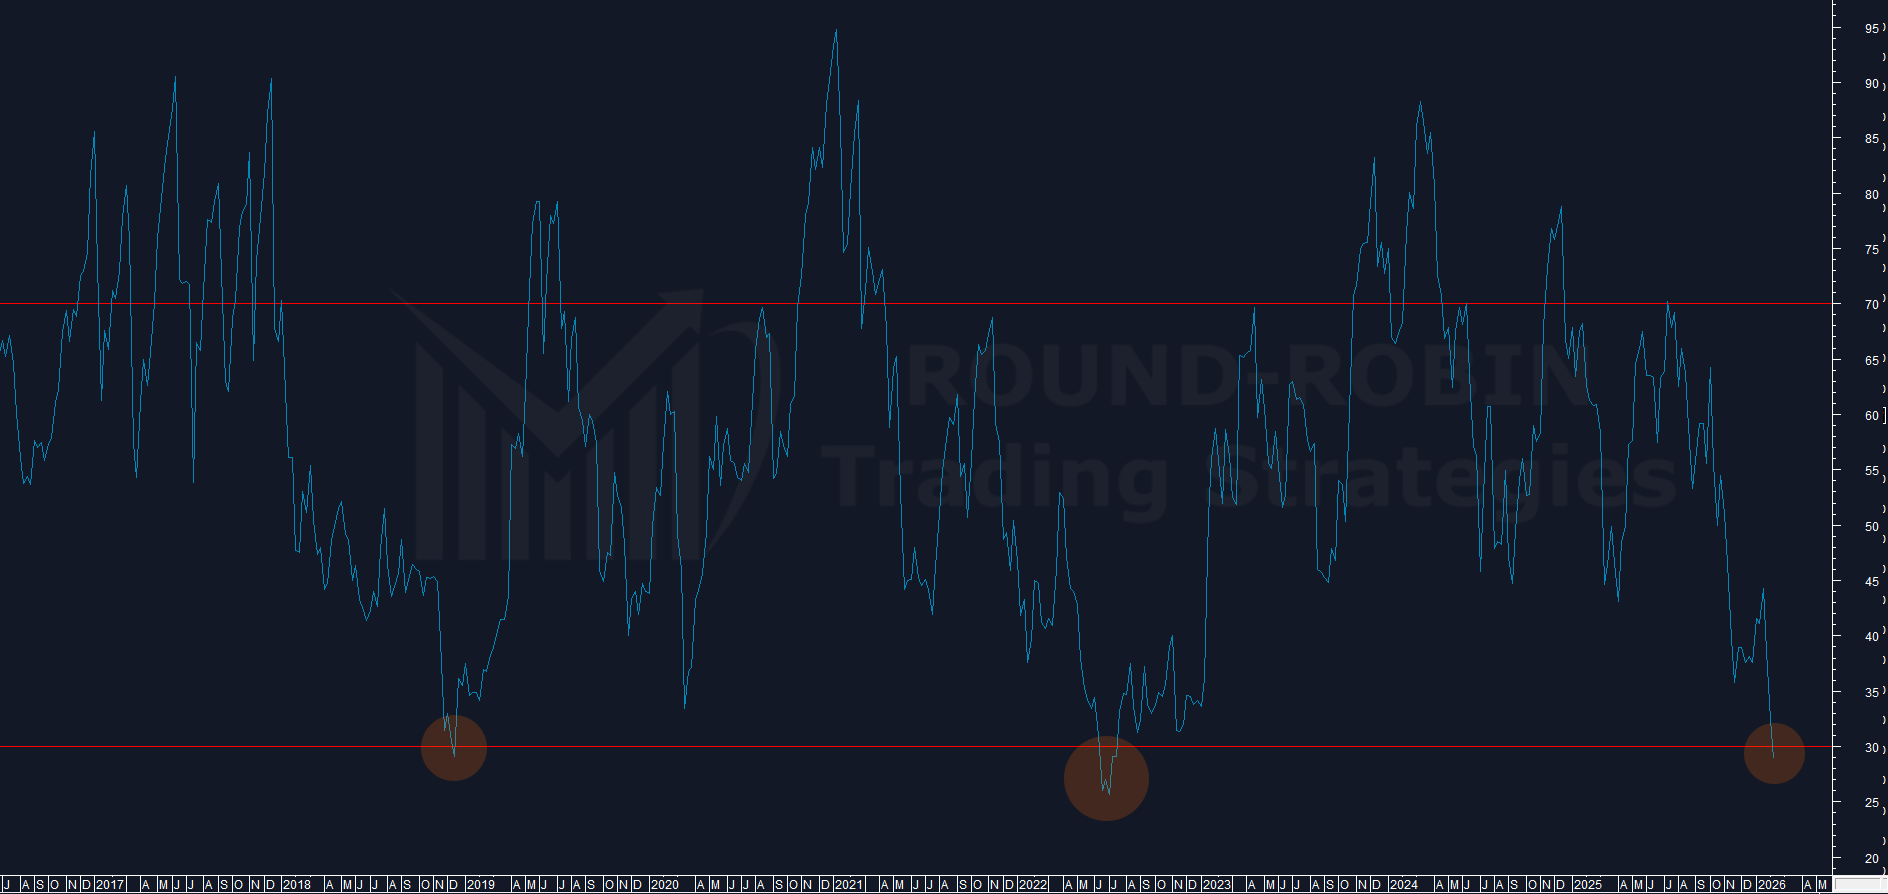
chart: Bitcoin – RSI oversold
It’s in slight oversold territory.
Attention: oversold and overbought aren’t used the way influencers tell you.
It’s an easy exercise, even for the laziest: it’s only happened twice in Bitcoin’s history.
- December 2018: remained trapped between 3,500 and 4,000 for four months.
- June 2022: closed at 20,500, low of 15,000 in November of the same year. The candle that marked entry into oversold wasn’t surpassed until March 2023.
This should be sufficient to understand what oversold signals.
But everyone’s free to keep cheering—the outcome won’t change.
Summary
| Indicator | Signal |
|---|---|
| 2022 Parallel | Requires re-touch of MA200W; from there the accumulation process could then start |
| Bearish cross MA20W/MA50W | Historically has led to bear markets |
| Weekly % range | Historically consolidates in the low area |
| Volatility indicator | The bottom of MA5W implies bear trend continuation for several more weeks—not necessarily violent, but sufficient to accompany previous conditions |
| Bonus: Weekly RSI | In oversold (only 2 past cases): consolidation/decline |
We have four concrete clues plus one.
Four heavy clues.
But we don’t have proof.
Conclusions
What could be the proof?
A clear rejection in the 73,000–75,000 zone.
Here we could verify if the bears are still there and if they’re aggressive.
This area was snubbed on the way down by terrified bulls.
If the bears use it, it will be a clear and unequivocal switch of strength—and definitively of medium-term trend.
Until there’s a different price signal: the long term remains bullish, the short-medium term remains bearish.
Soon only members will access this content. Subscribe free.
Leave a Reply