


Weekly appointment with the world’s most watched charts.
After weeks of testing, retesting, and holding, the MA20W finally gave way. The S&P 500 closed at 6,740.02, more than 100 points below the MA20W. The entire candle body sits under it. Since our first S&P 500 Chart of the Week in W02, we defined two conditions for a bearish trigger: a weekly close below the MA20W and a clear price signal. Both are now met.
The volatility indicator reacted sharply from its historical floor. The fear indicator jumped to 85%. Bears dominate the weekly reading nearly 2.6 to 1.
The framework spoke. Let’s read it.
Bulls vs Bears
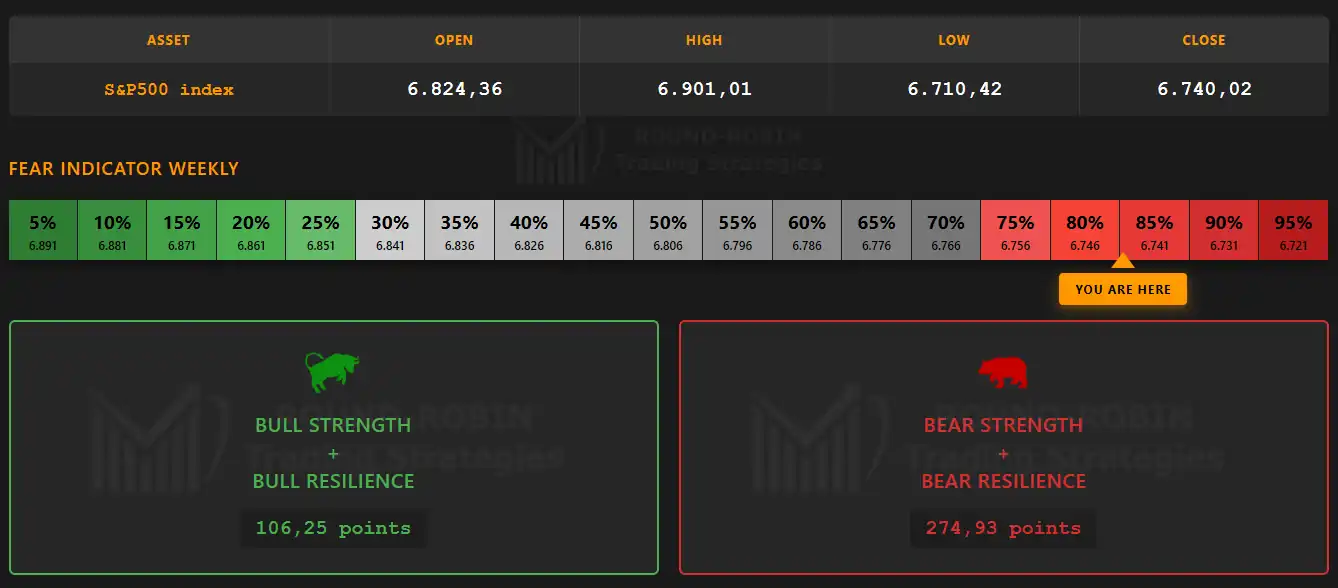
infographic: S&P500 weekly – Bulls vs Bears
The weekly infographic confirms the shift. Bear Strength plus Bear Resilience total 274.93 points against 106.25 for the bulls, nearly 2.6 to 1 in favor of the bears. The Fear Indicator sits deep in the red zone at 85%. Just a few weeks ago, when the deep dive noted “almost no concern for potential downside,” it stood at 30%.
The market’s mood has changed.
The Big Picture
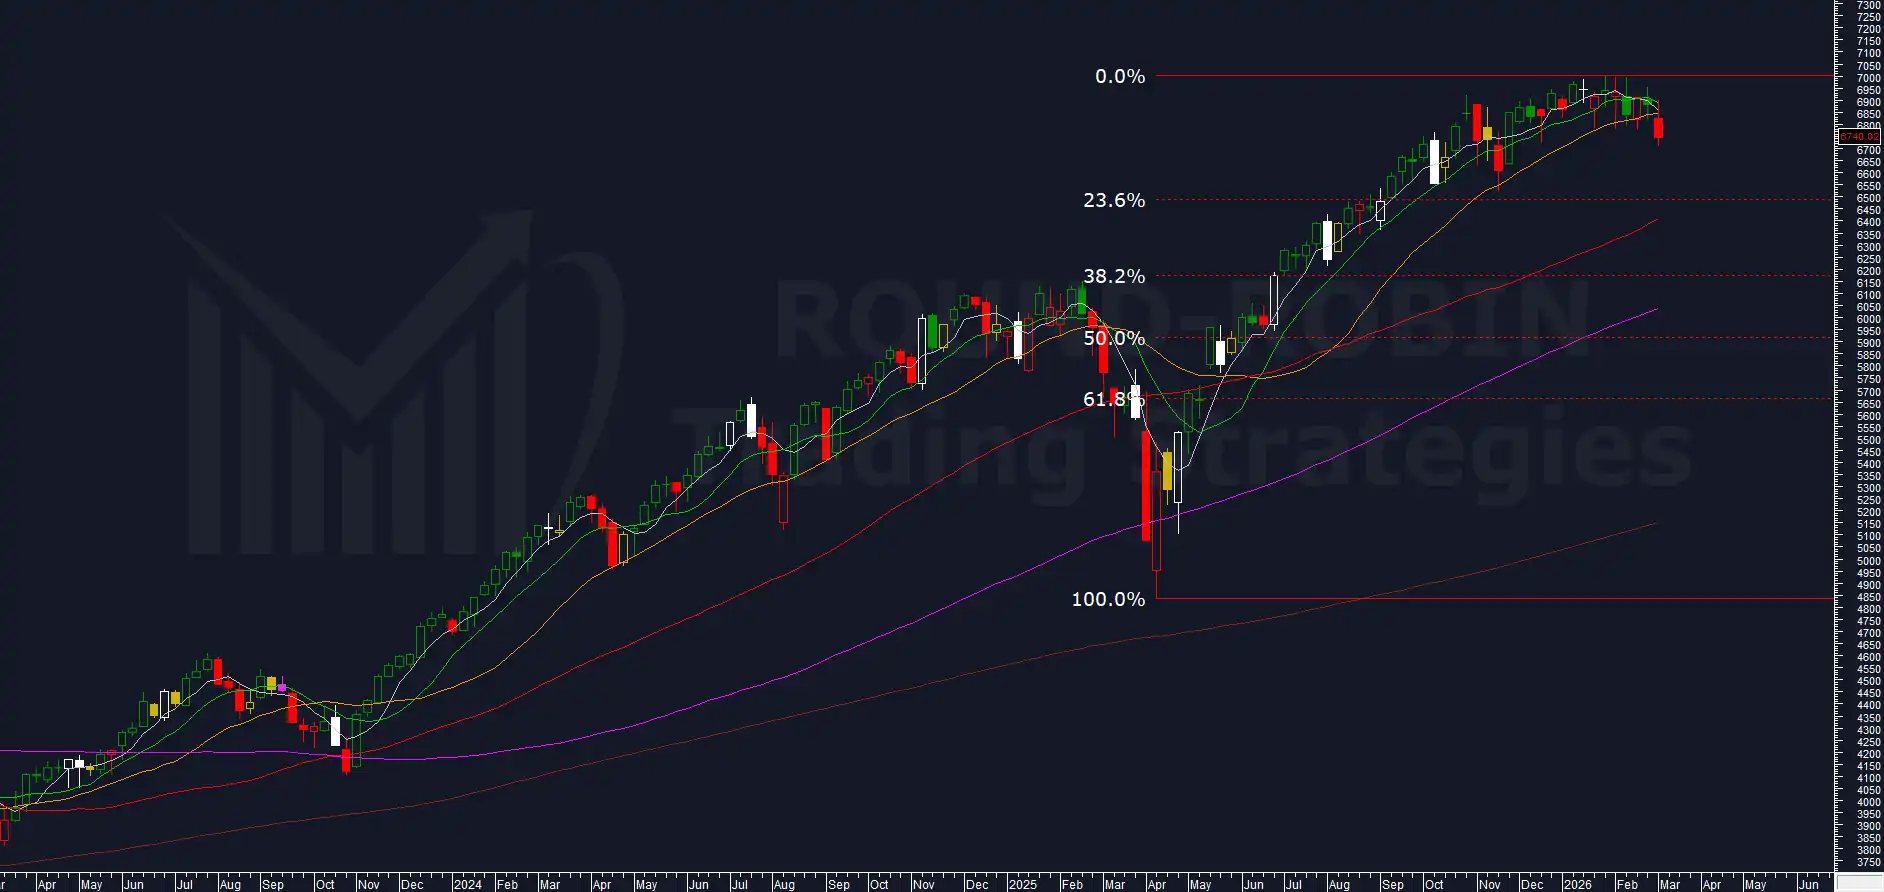
chart: S&P500 weekly
The S&P 500 closed the week at 6,740.02. The MA20W stands at 6,846.27.
The break is unambiguous. Open at 6,824.36, close at 6,740.02. The entire candle body below the MA20W. Only the upper shadow (high at 6,901.01) crossed it briefly intraweek. Close below open: a bearish candle.
Since our first S&P 500 analysis in W02, and through the deep dive and every Charts Flash, we have repeated the same framework: the MA20W has been the support line for every S&P 500 rally since 2020. Every bull impulse in this multi-year uptrend ended when prices broke below the MA20W. Same trend, same hands.
In the Chart of the Week two weeks ago, we defined the trigger: only weekly closes below the MA20W accompanied by a serious price signal would represent a genuine trigger for bearish strategies.
Both conditions are now satisfied. Weekly close below the MA20W and a clear bearish price signal: the full body under the level, close lower than open.
The MA5W has completed its bearish cross below the MA10W, something we flagged as almost inevitable two weeks ago. Both are now negatively inclined. The rounding pattern is completing to the downside.
Looking at Fibonacci retracements from the April 2025 low to the all-time high: the MA50W (red, area ~6,410) is heading towards the 23.6% retracement level. If the decline unfolds gradually rather than as a vertical crash, the MA100W (purple) would have time to rise towards the 38.2% Fibonacci zone, which coincides with the highs of December 2024 to February 2025. A significant technical confluence.
Volatility Indicator
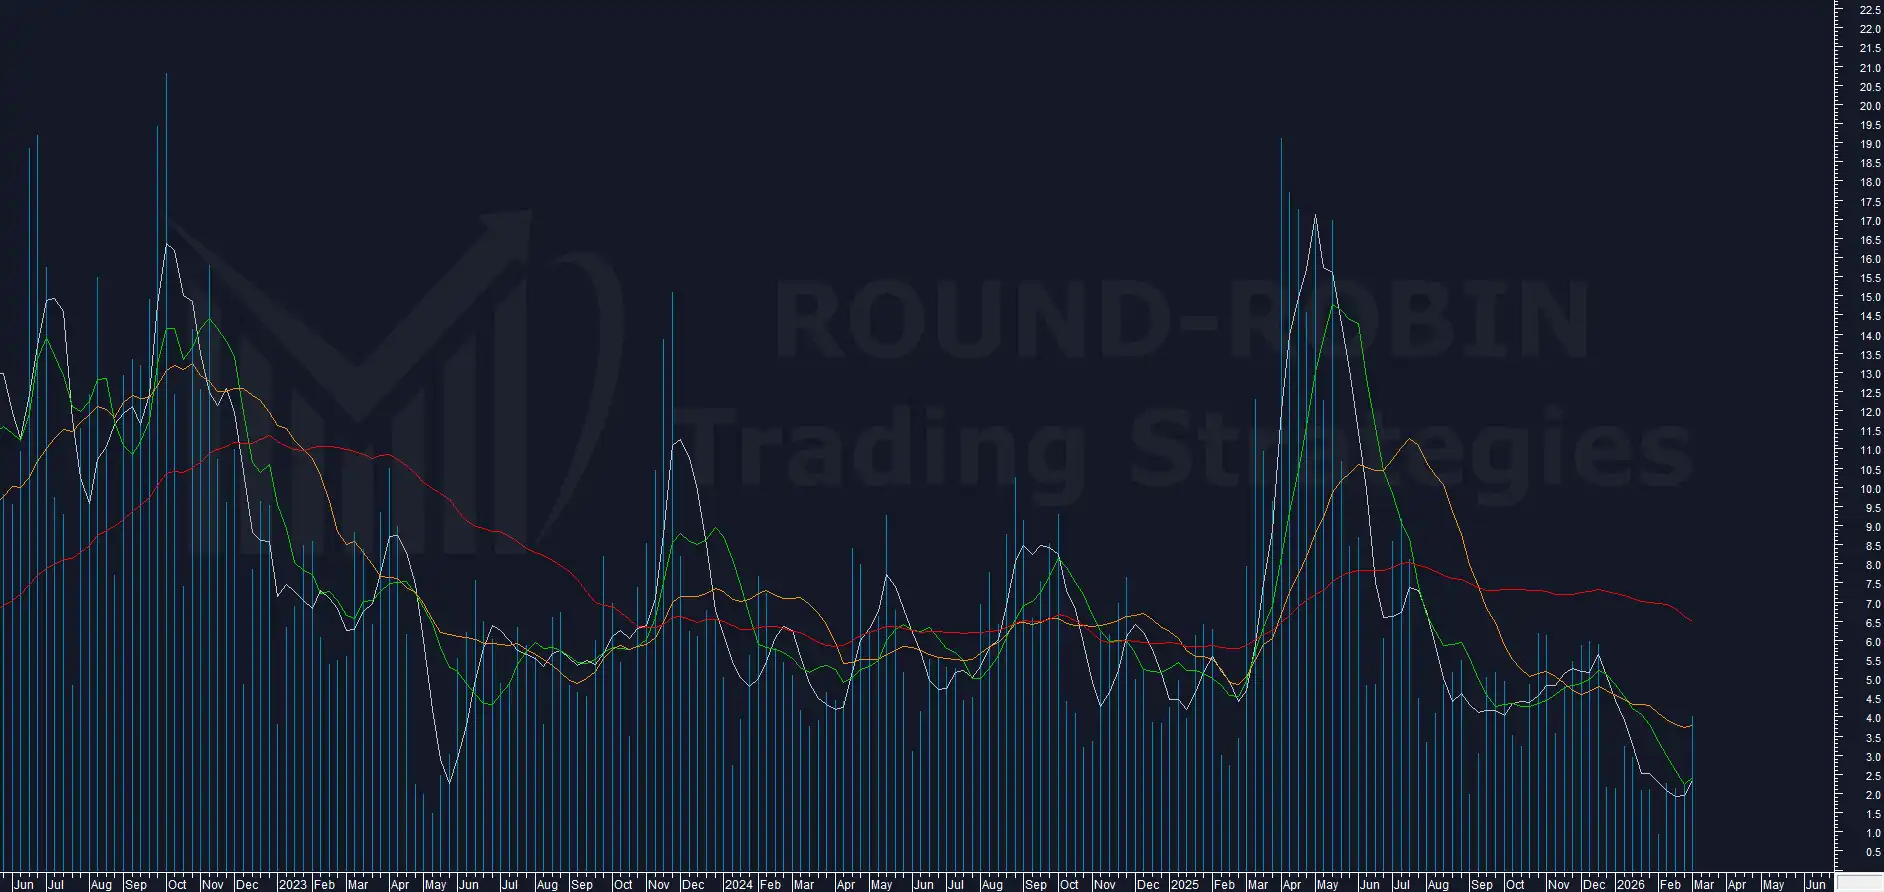
chart: S&P500 – proprietary Volatility Indicator
This week the indicator reads 4.03%, a sharp jump from the 2.10–2.25% range of recent weeks. That said, it remains well below the peaks reached between October and December.
The key development is in the MA5W calculated on the indicator. As noted in the deep dive, it had reached the same minimum levels seen in June 2021 and May 2023, the lowest volatility the US index can sustain.
In both prior cases, the reaction from those volatility lows led to a continuation of the bull market, which eventually ended with a break of the MA20W. This time the sequence is different: the break arrived directly, without an intermediate rally phase. The market skipped a step. This is a notable divergence from the historical pattern and speaks to the underlying weakness of this leg.
Overextension on MA200W
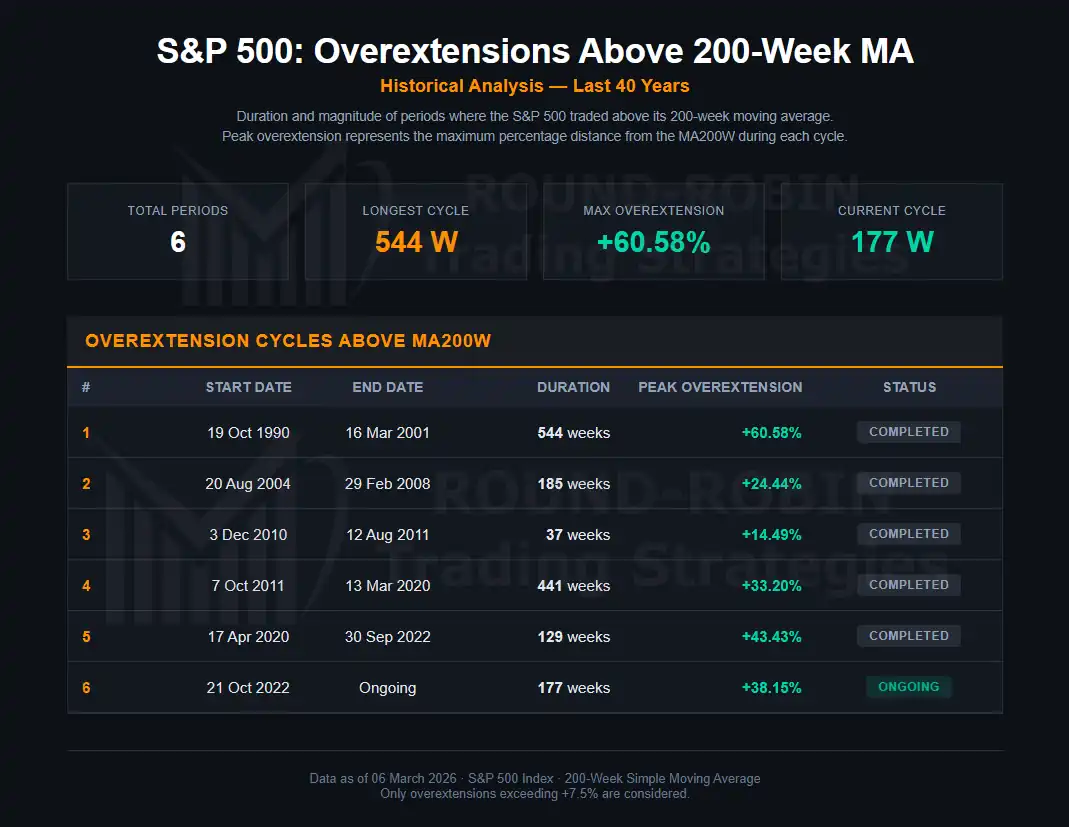
table: S&P500 Overextensions Cycles Above MA200W
Current readings: +30.22% above the MA200W, +11.16% above the MA100W, +4.71% above the MA50W.
The premium has been compressing, from +38.15% at its peak down to +30.22% now. But at over 30%, the overextension remains significant. We are still a long way from the MA200W.
What we know from 40 years of data is that this level of overextension has historically been fully reabsorbed. The ultimate target of this move is the MA200W.
In the near term, the MA50W (~6,410, currently +4.71% below prices) is the first target. At this stage, difficult to avoid. The MA100W (+11.16% below) is the intermediate target, with reasonable probabilities of offering some support depending on the speed of the decline. A gradual descent gives the moving averages time to rise and meet the price; a fast crash leaves them behind.
Conclusion
The framework is clear: below the MA20W, the bias is bearish.
The MA50W is the first target. The MA100W, roughly 11% below current levels, is the intermediate objective. The MA200W remains the final destination for this overextension cycle.
Given the 11% distance to the MA100W, a stop placed 1.0% above the all-time high preserves a risk-reward ratio of approximately 2:1.
A bullish recovery of the MA20W at next week’s close will trigger the Exit Short. This applies only to the next week not for the following ones.
MA20W breaks. The trend has changed.
Leave a Reply