


Quick observations on the charts that caught our eye this week.
This week’s flash covers EUR/USD, Nikkei 225, Gold, Silver and Bitcoin – with EUR/USD finally delivering its long-awaited bearish confirmation, the Nikkei pulling back hard from record overextension, Gold printing an outside candle, Silver mirroring it with an even wider one, and Bitcoin getting rejected right at resistance.
This is not meant to be a full analysis – just food for thought on a few charts that caught my attention this week.
⚡ EUR/USD
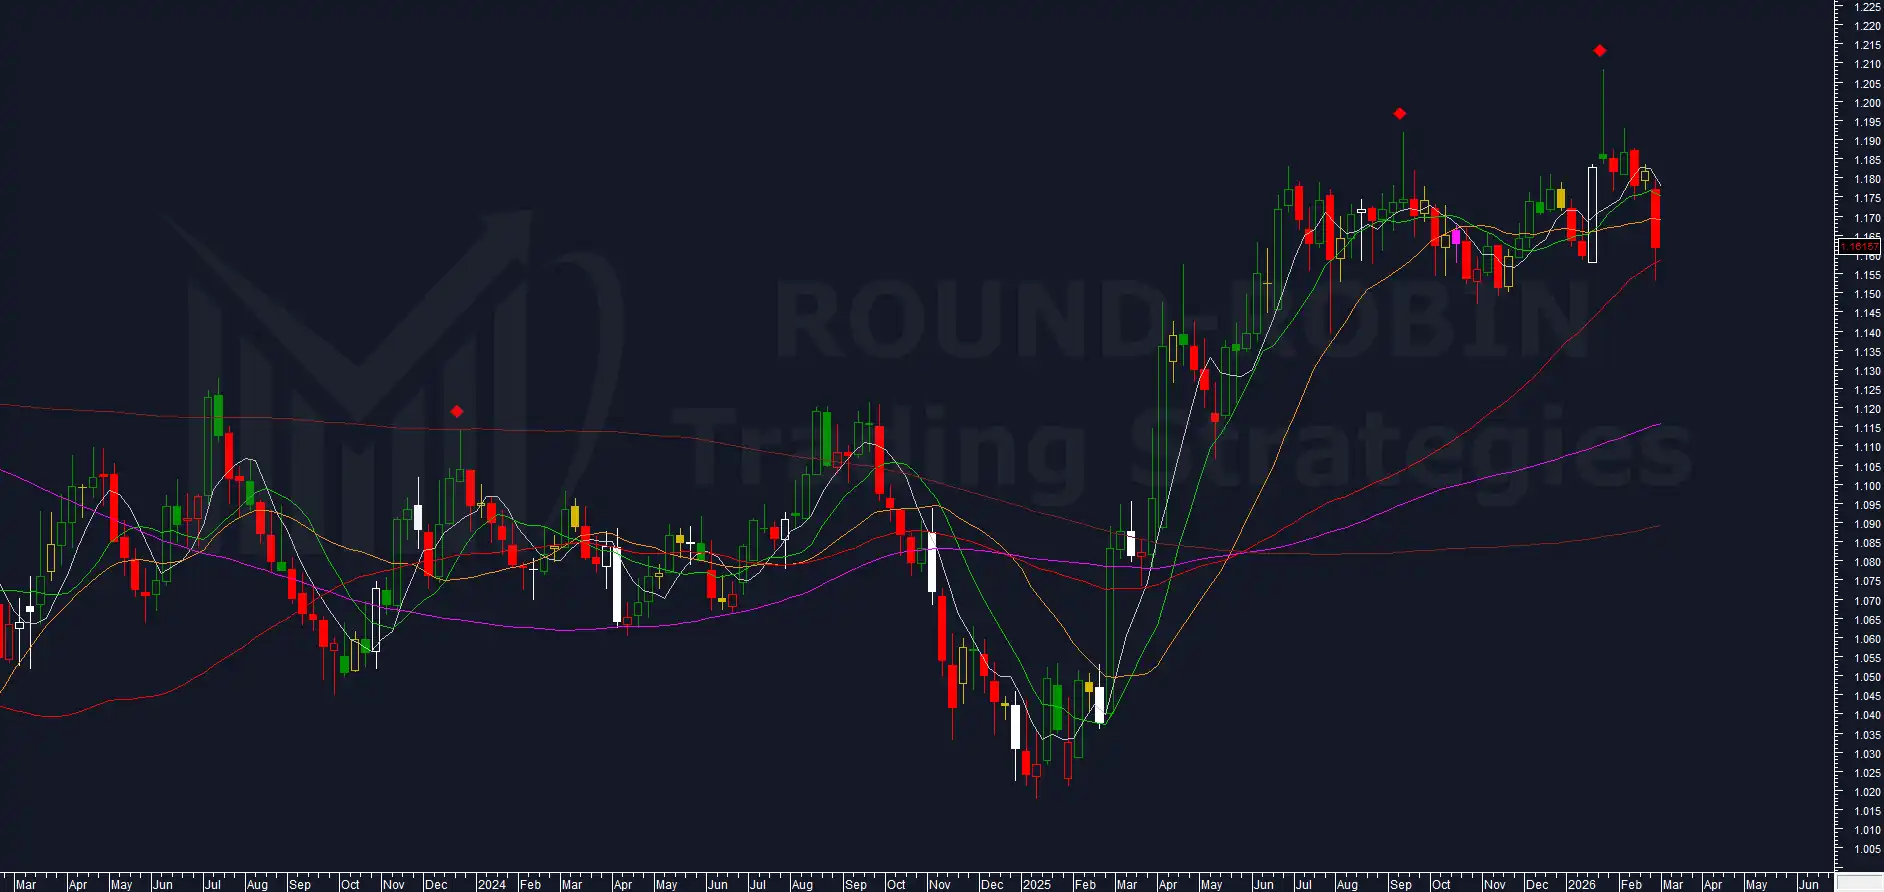
chart: EUR/USD weekly
We called it the King of Shooting Stars – and after a long wait, the confirmation has finally arrived.
A decisively bearish week, with prices bouncing off the MA50W before partially recovering. The weekly close at 1.1617 breaks below the MA20W, which must now act as resistance to confirm the bearish trend.
Minimum target: 1.14 area.
For the full EUR/USD framework, see our Chart of the Week.
⚡ NIKKEI 225
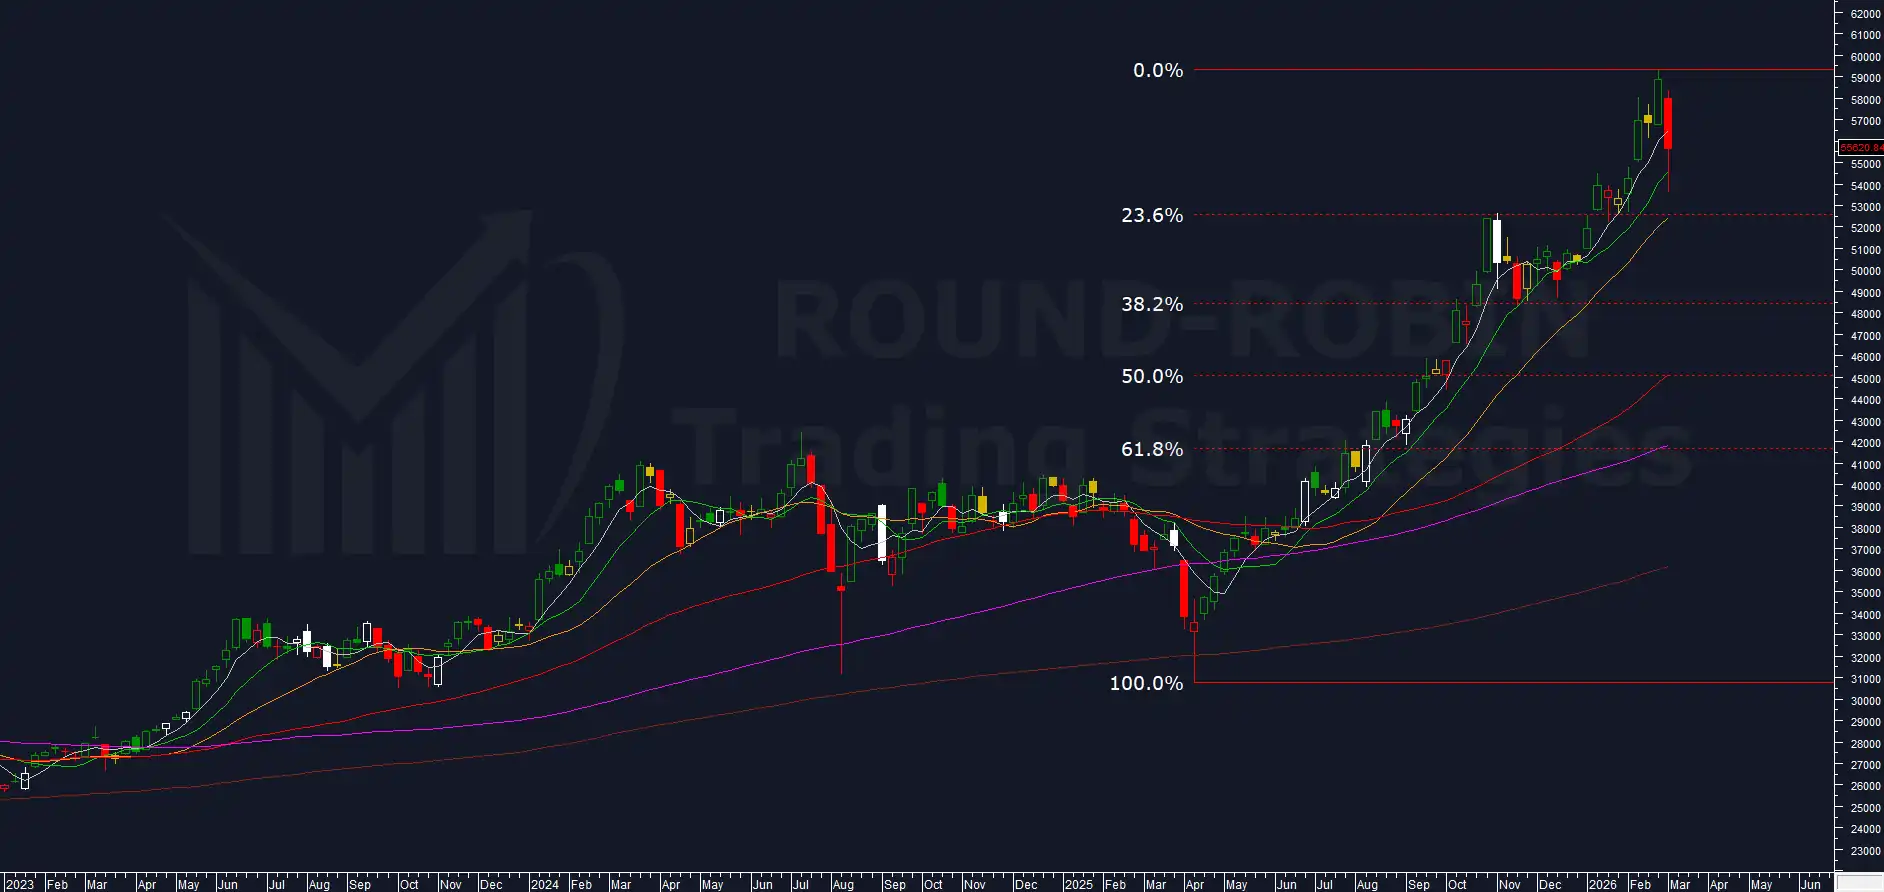
chart: Nikkei225 weekly
The record overextension on the MA200W flagged in last week’s Chart of the Week paid off immediately.
The Japanese index dropped from last Friday’s close of 58,850 to an intraweek low of 53,618.20 on the MA10W – a decline of approximately 8.9%. Weekly close at 55,620.84.
The hold at the MA10W is a problem for the bears, who now absolutely need to defend the MA5W area (around 56,500) to retain control.
The minimum target remains the MA20W, which corresponds to a 23.6% Fibonacci retracement of the April 2025 – March 2026 move. That level sits in the 52,500 area – and it’s worth noting that 52,600 was the November 2025 high, so a pullback to that zone could complete a textbook retest.
⚡ GOLD
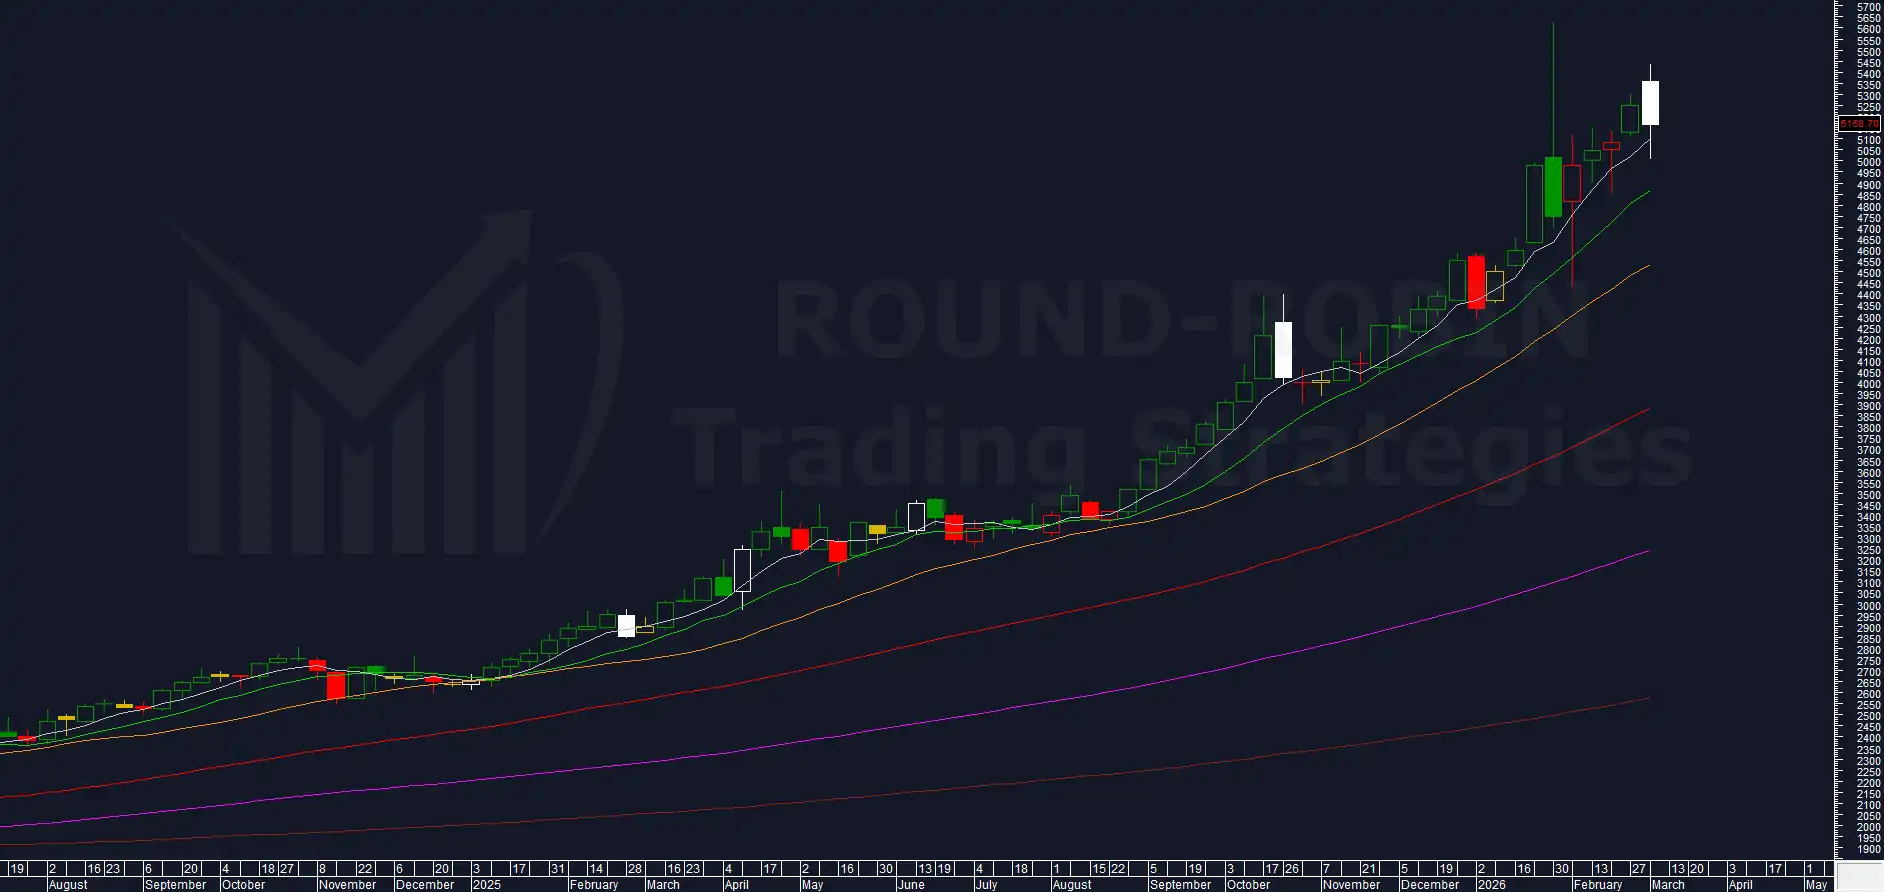
chart: Gold weekly
Prices continued to advance into the long upper shadow of the January 30th candle, but this week the bears reacted, creating an outside candle. The MA5W (around the 5,100 area) seemed like it could give way but held thanks to a bull reaction. Nothing changes.
Weekly close at $5,158.70.
Only in the context of a spread trade with Silver can a Long position be considered. For independent trades, we wait for a bearish signal.
According to our combined Volatility + RSI study, at most 2 weeks remain before a trend reversal signal.
The strategies remain unchanged:
- Spread trade: Long Gold + Short Silver – we follow the process and respect the trend.
- Only Gold: Wait for a bearish price signal along the upper shadow of the January 30th, 2026 candle.
⚡ SILVER
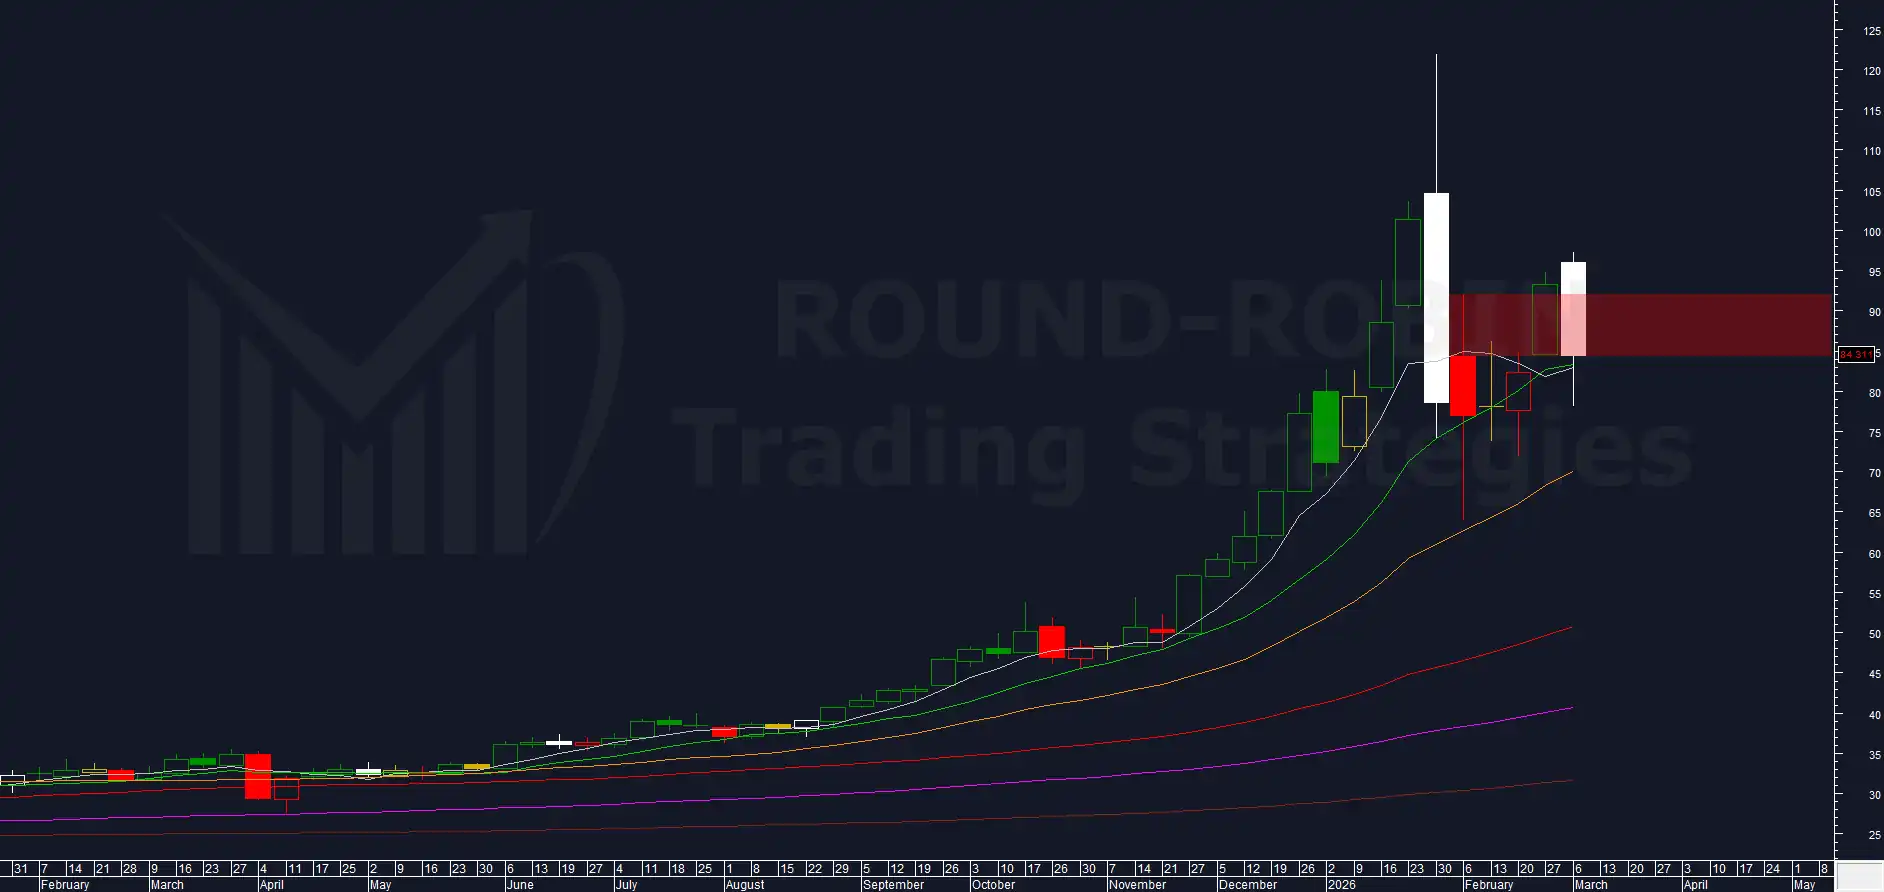
chart: Silver weekly
Silver also printed an outside candle – and a much wider one than Gold’s, with a range from $78.06 to $97.30.
It’s worth remembering that the 2011 crash was preceded by an outside candle on top – we are now watching whether this relative high produces the same bearish pattern.
Midweek it looked ready to deliver a major bear signal, but in the second half of the week prices recovered the MA5W, the MA10W and came within a hair of reclaiming the prior week’s low. Weekly close at $84.31.
Still: do not touch Silver. The signal is not there yet.
For bearish confirmation, watch for a weekly close below $82 (under the moving average area). On the upside, breaks above $92-95 would provide long indications.
In the context of the spread trade with Gold, the Silver position remains short.
For the full view on our Silver thesis, see The Anatomy of a Bubble Burst.
⚡ BITCOIN
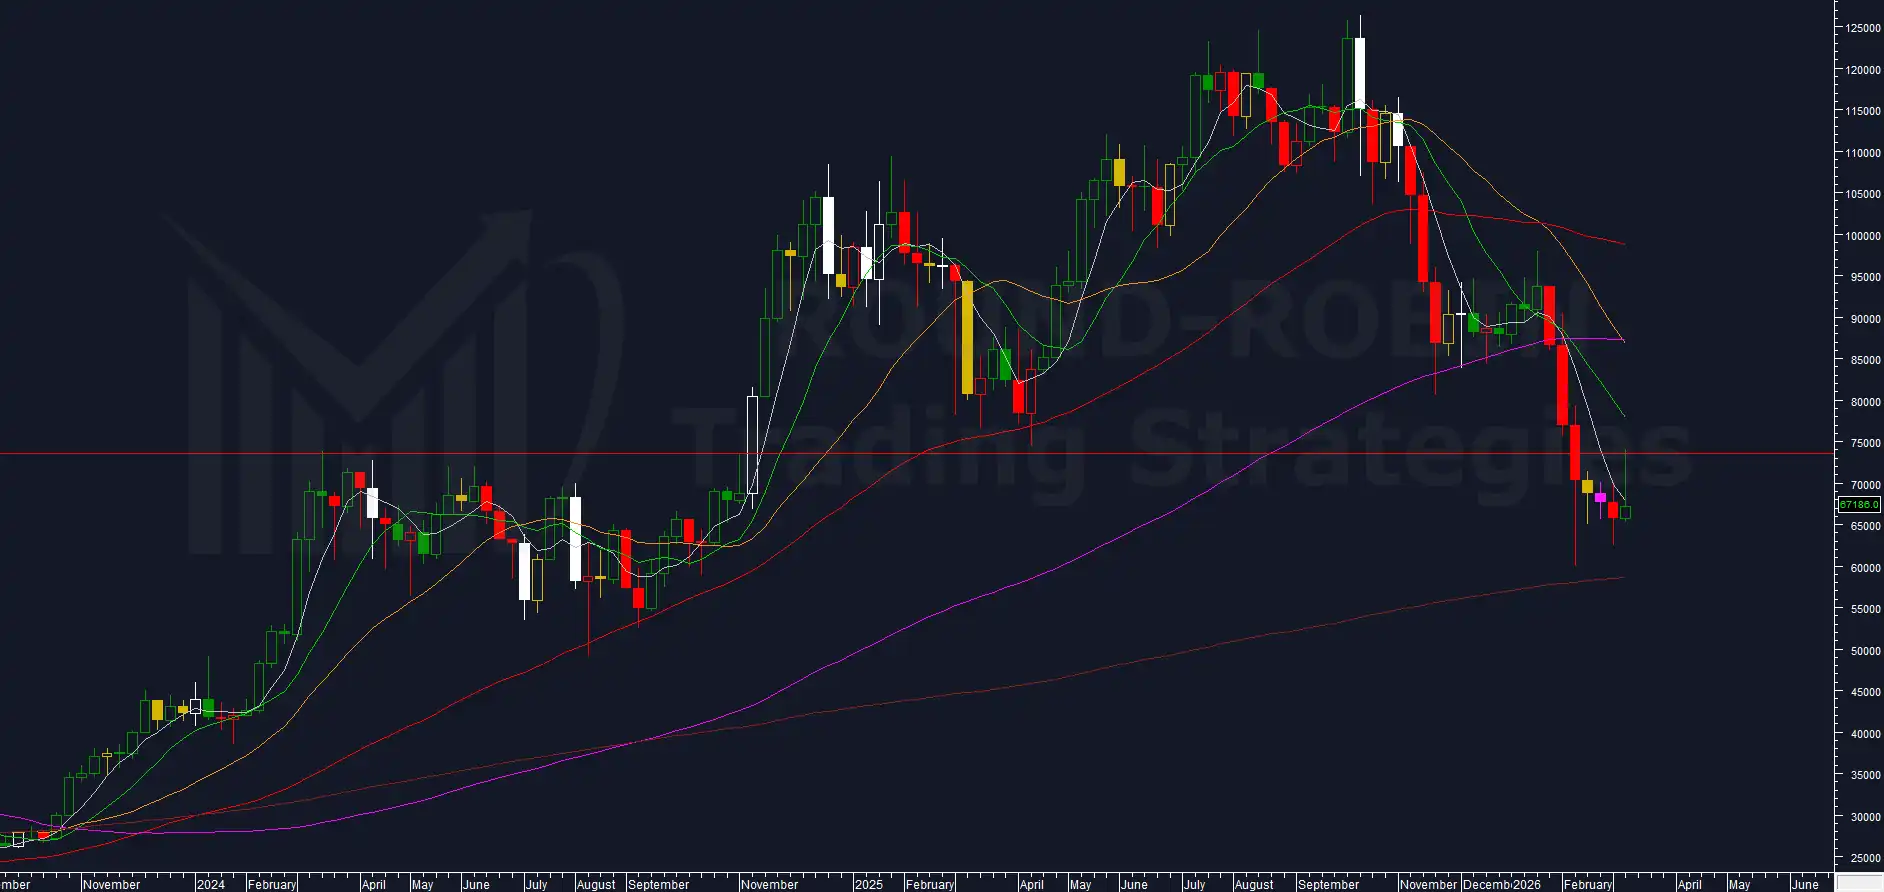
chart: Bitcoin weekly
We said to watch the $73,000-75,000 area where resistance sits – and the bears showed up right there, pushing prices back down to $67,000 for now.
The weekly high at $74,100 confirms the resistance zone. Highs and lows are rising, but the rejection was significant and leaves our $58,000 target intact.
The MA5W (around the 67,900 area and falling) remains the level to watch: prices below it keep the bearish structure alive.
For the full breakdown of levels and scenarios, refer to this Charts Flash.
Soon only members will be able to access this content. Sign up for free.
Leave a Reply