


Weekly tracking of the Italian benchmark index.
Why do we do this? Check out our strategy page.
My proprietary DBBT indicator identifies misalignments between current price and expected technical levels on major indices.
Every week, the FTSE MIB is in our crosshairs.
The hunt is on.
Let’s pick up from where we left off.
A week that looked like it had started in the worst possible way, around the 42,800 area, closed at 44,316.92 — up 0.37% from the previous week.
Has the bearish momentum run out of steam?
Let’s try to bring some order to the volatility chaos.
Bulls vs Bears
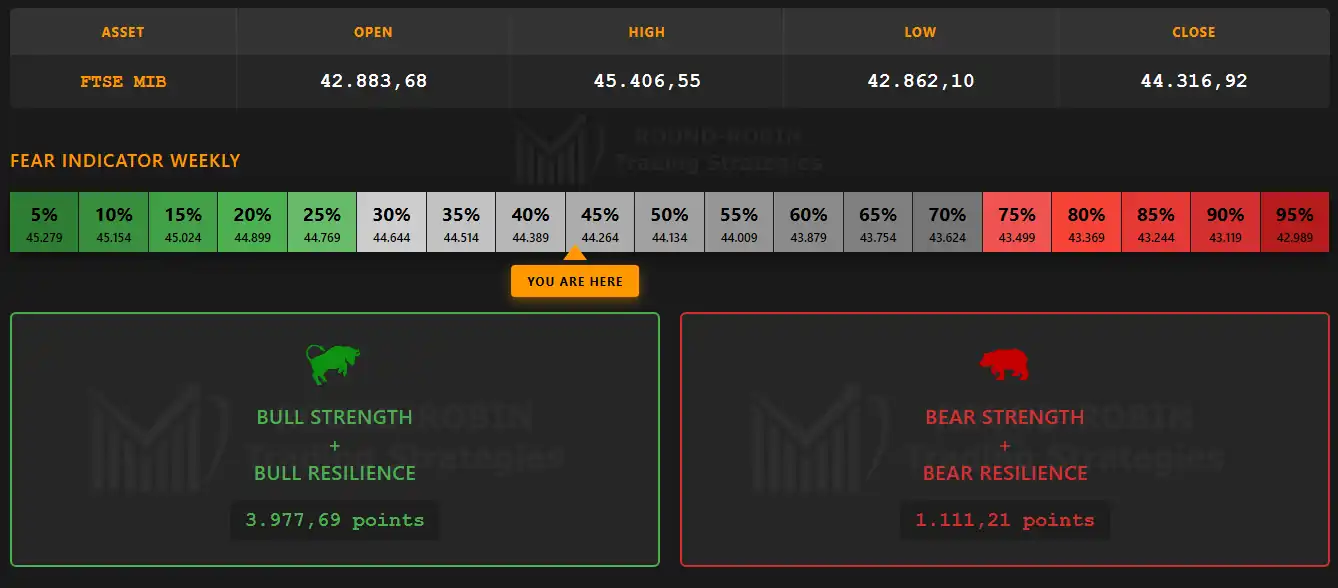
infographic: FTSE MIB weekly – Bulls vs Bears
Let’s start with the numbers.
Despite lower highs and lower lows for the second consecutive week, the session closes firmly in favor of the bulls, with the fear indicator returning to neutral territory after last week’s near-panic reading.
The numbers are clear: the bulls are there and well positioned at key levels.
Monday’s touch of the daily MA200 is a textbook example.
But once we put those numbers in context, the picture that emerges may look somewhat different.
The Big Picture
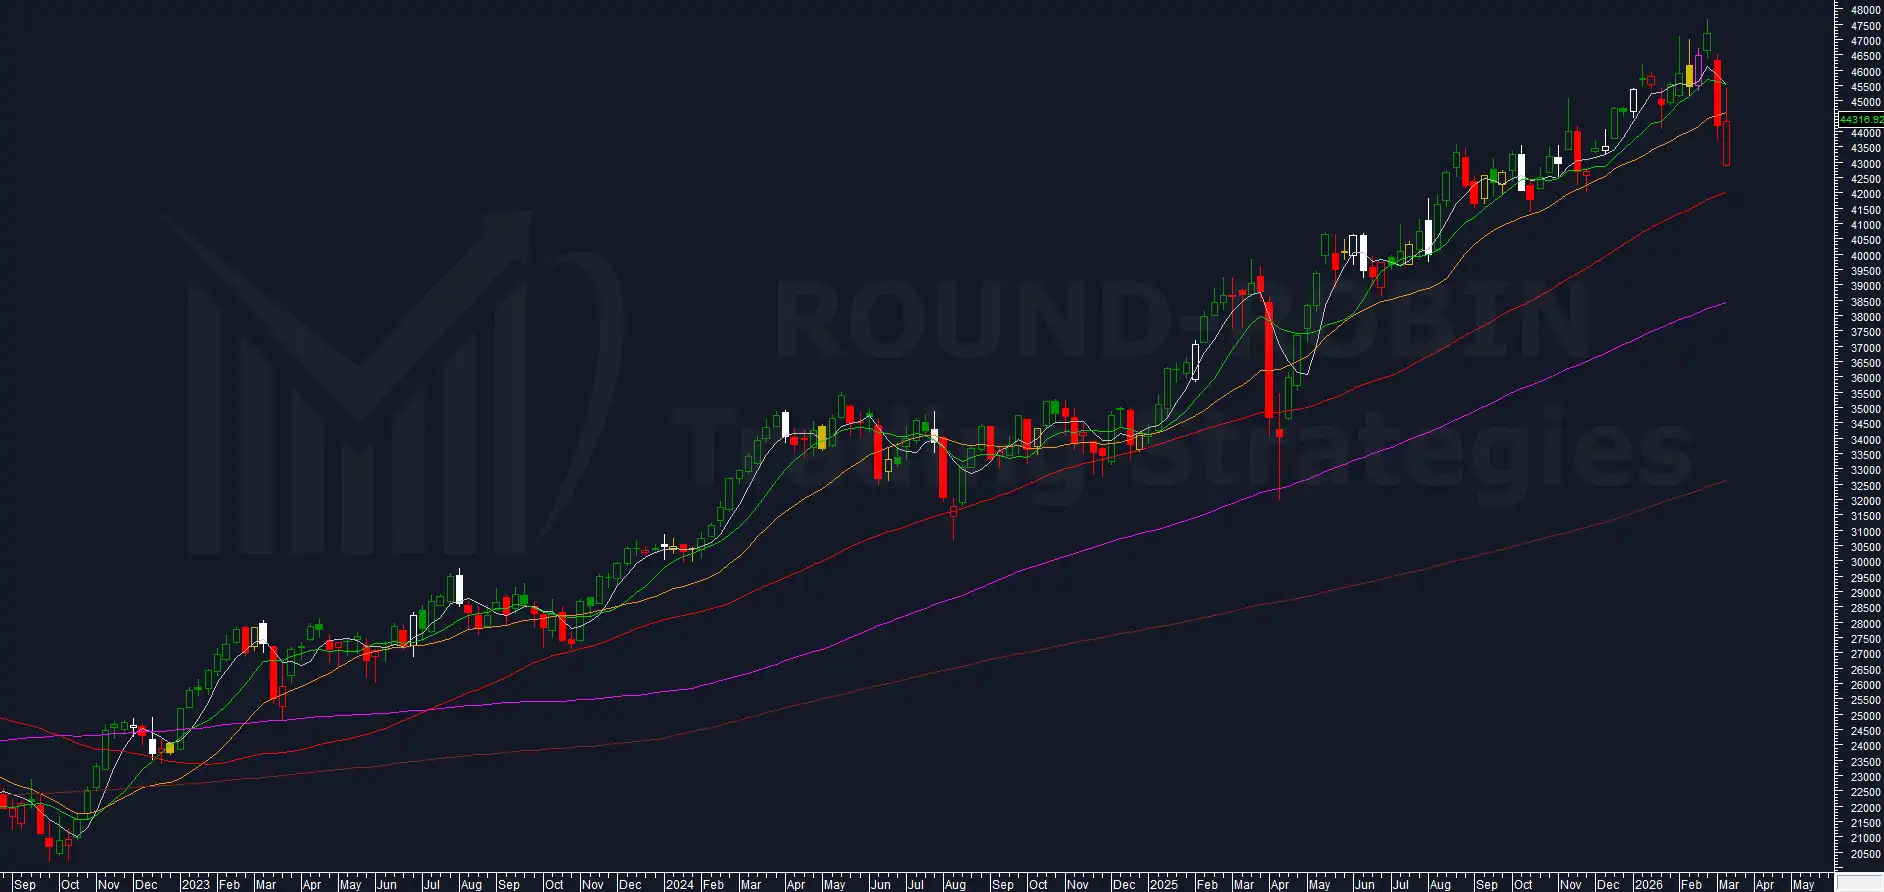
chart: FTSEMIB weekly
This is where things get more interesting.
Last week the FTSE MIB broke below the MA20W.
This week the gap down opening failed to hold and prices bounced quickly back up to the MA5W and MA10W — now at the same level — which acted as resistance and pushed prices back below the MA20W.
The MA5W has crossed below the MA10W, albeit by a narrow margin.
Technically, the short-term downtrend remains intact, unchanged from the previous week.
The solid proportions of the candle body could leave room for another bull attempt, but the bears have so far shown they control the critical levels.
Volatility Indicator
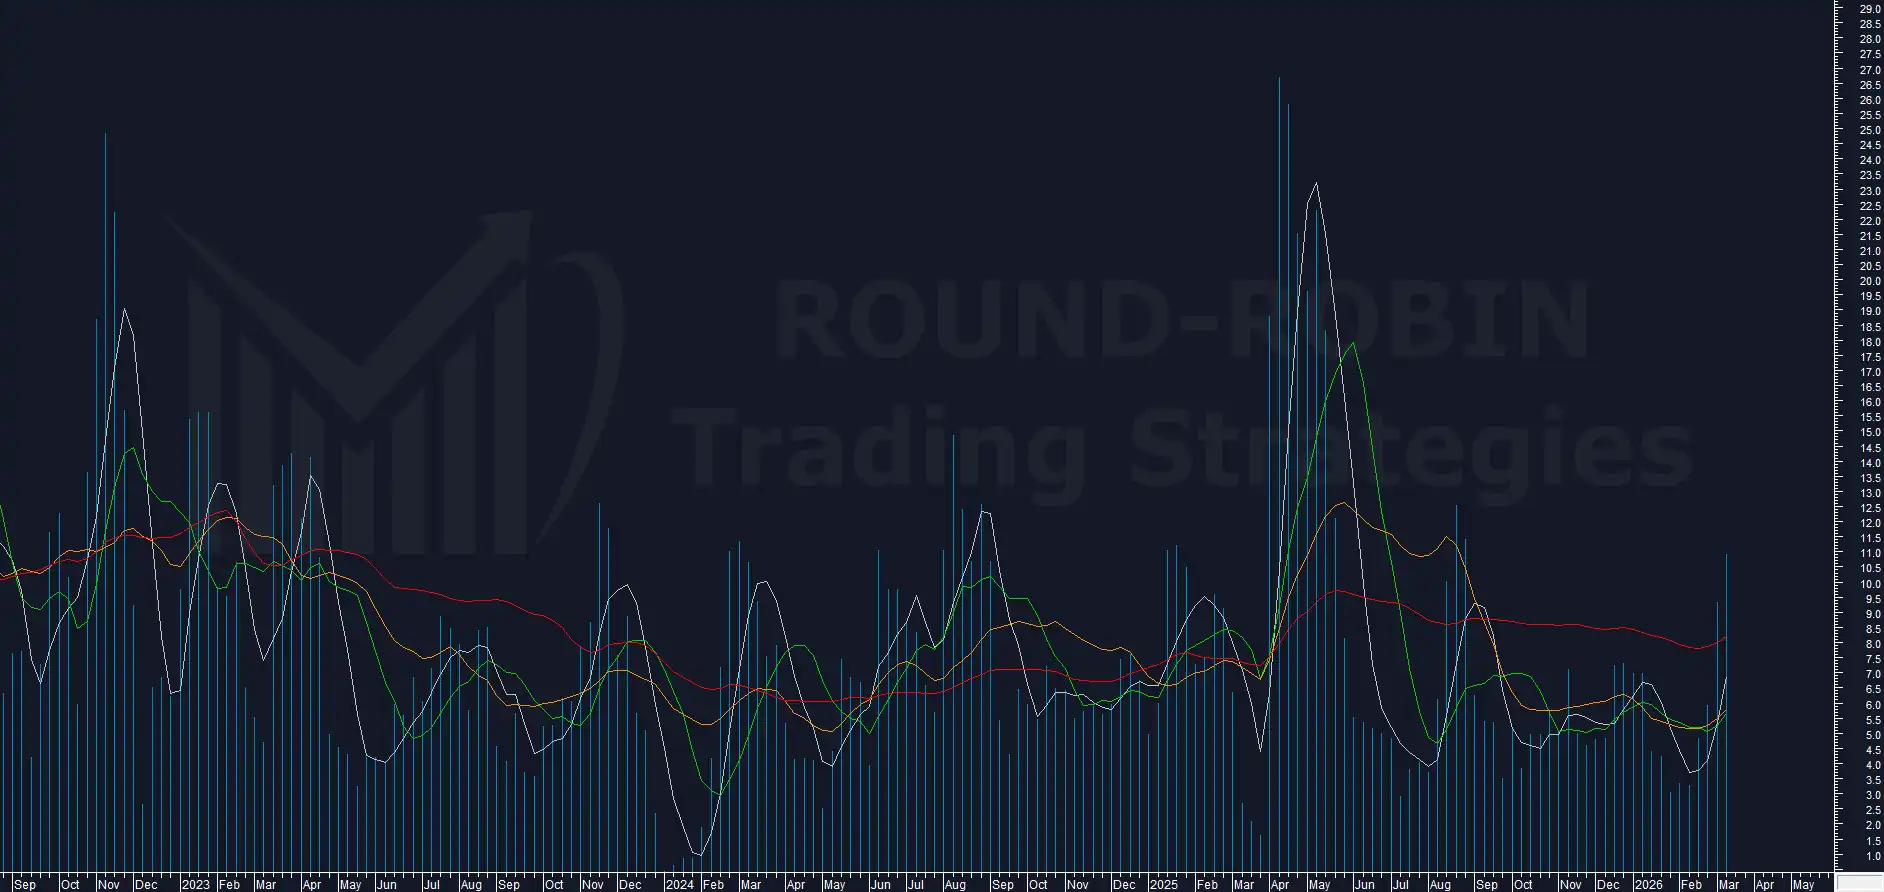
chart: FTSE MIB proprietary Volatility Indicator
Our proprietary volatility indicator continues to climb: from 9.35% to 10.96%.
The weekly range has slightly contracted, from 6.52% to 5.94%.
This divergence between an expanding indicator and a contracting range may point toward an upcoming consolidation phase.
RSI
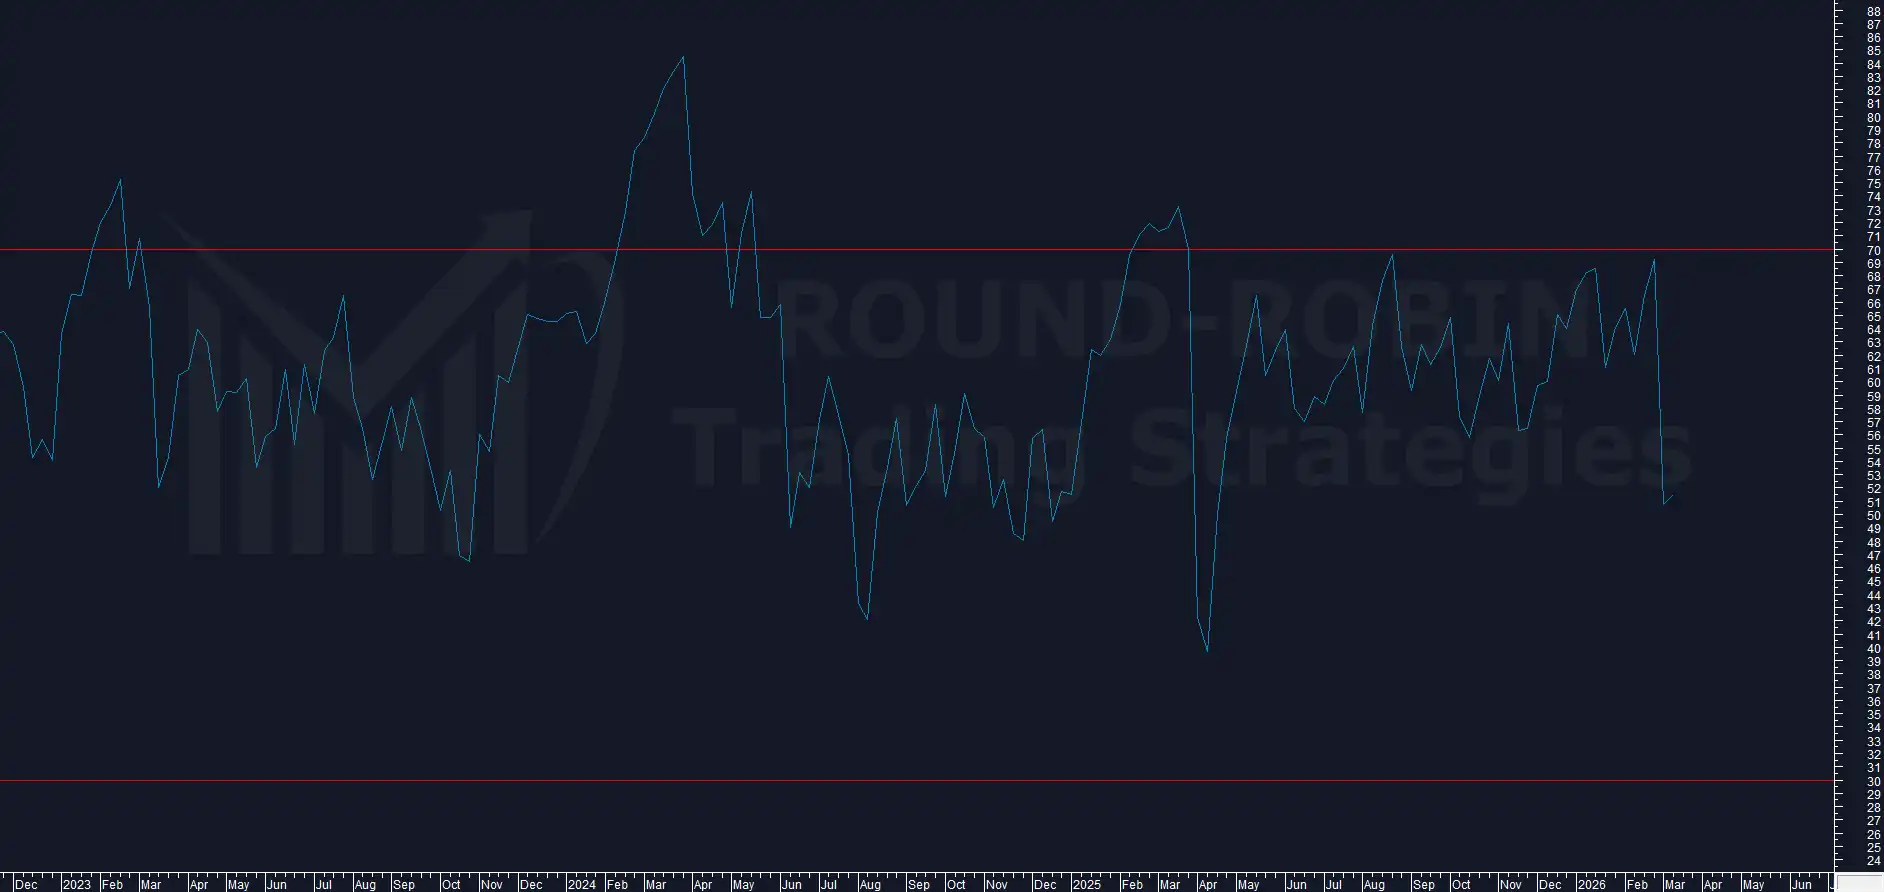
charts: FTSE MIB – RSI weekly
The target remains the 40-42 area.
This week the RSI lifted its head slightly, without altering the broader picture.
Strategy Update
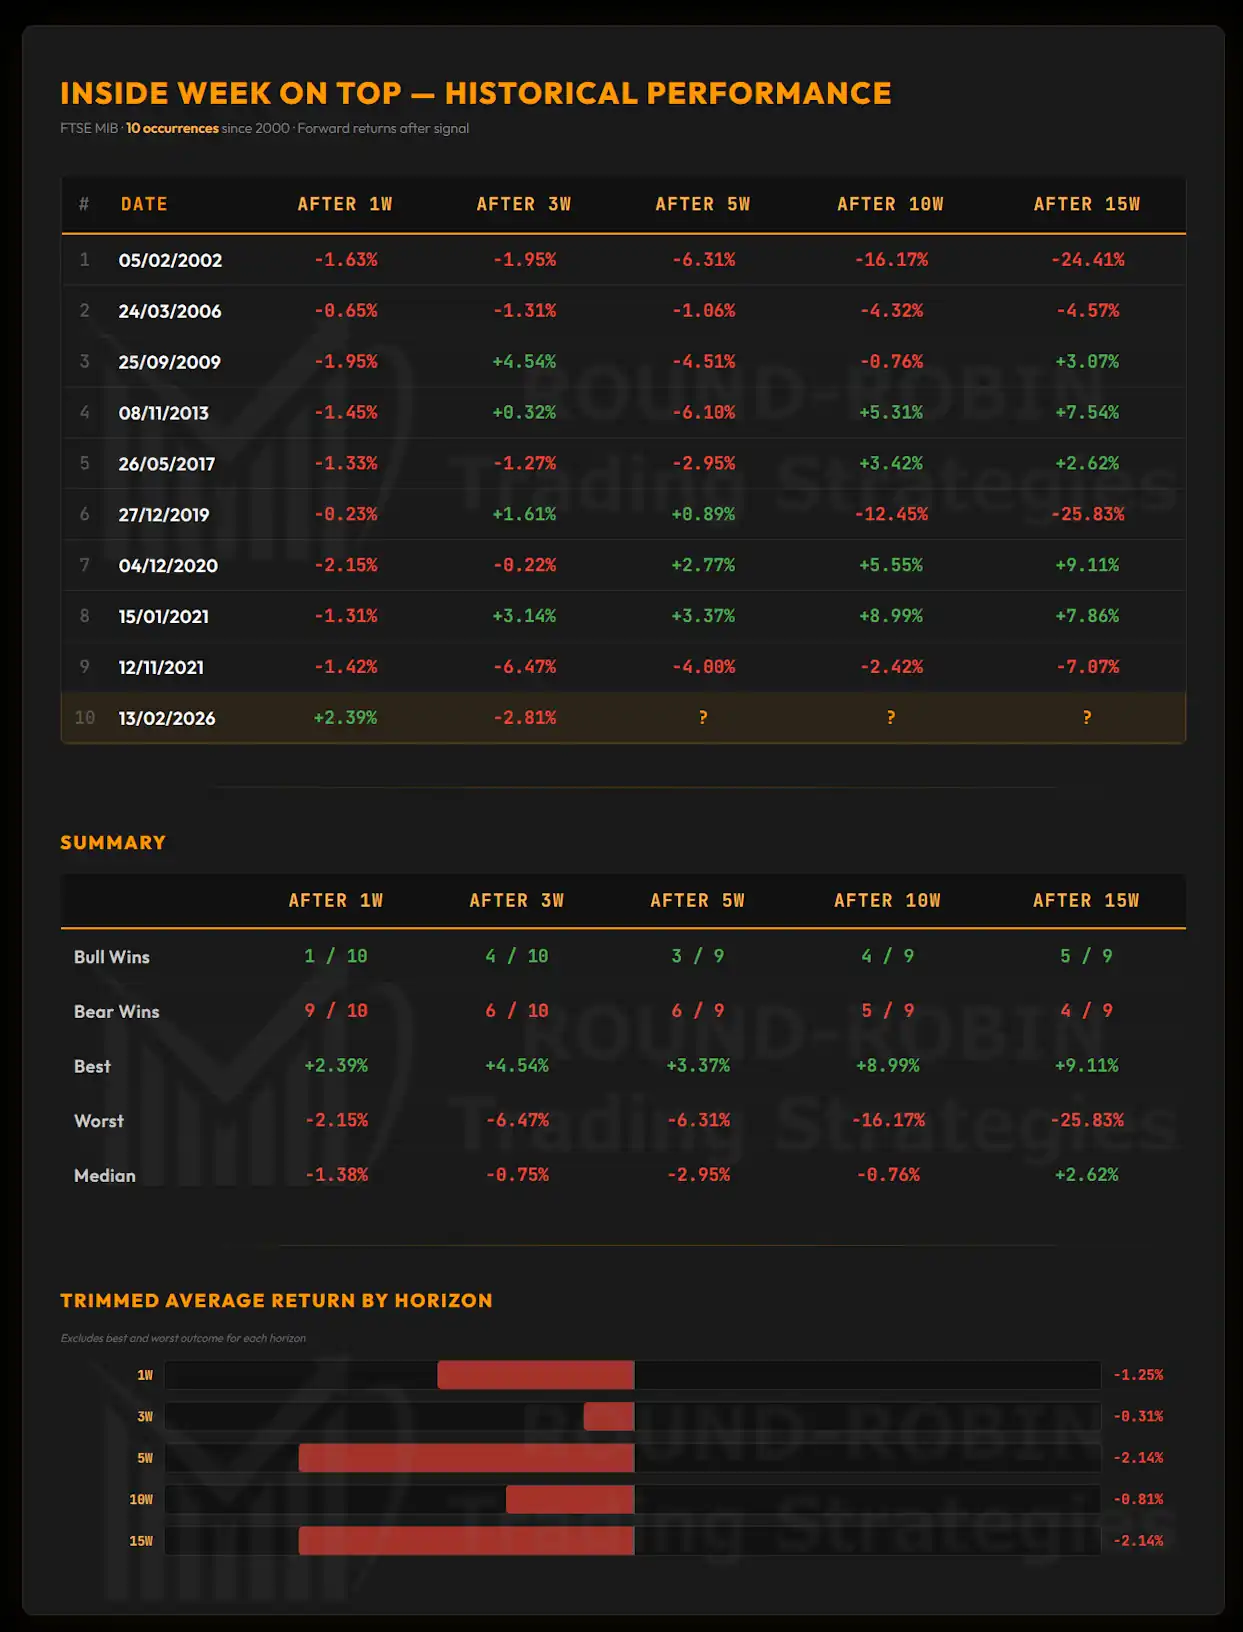
infographic: FTSE MIB Inside Week on TOP pattern
Five weeks ago we presented this study on the rare Inside Week on Top candle pattern.
Next week not only marks the completion of the fifth week — statistically the most critical one — but also coincides with futures and options expiration.
Combined with the current trend, this should statistically reduce the probability of a bullish recovery in the week ahead.
Daily
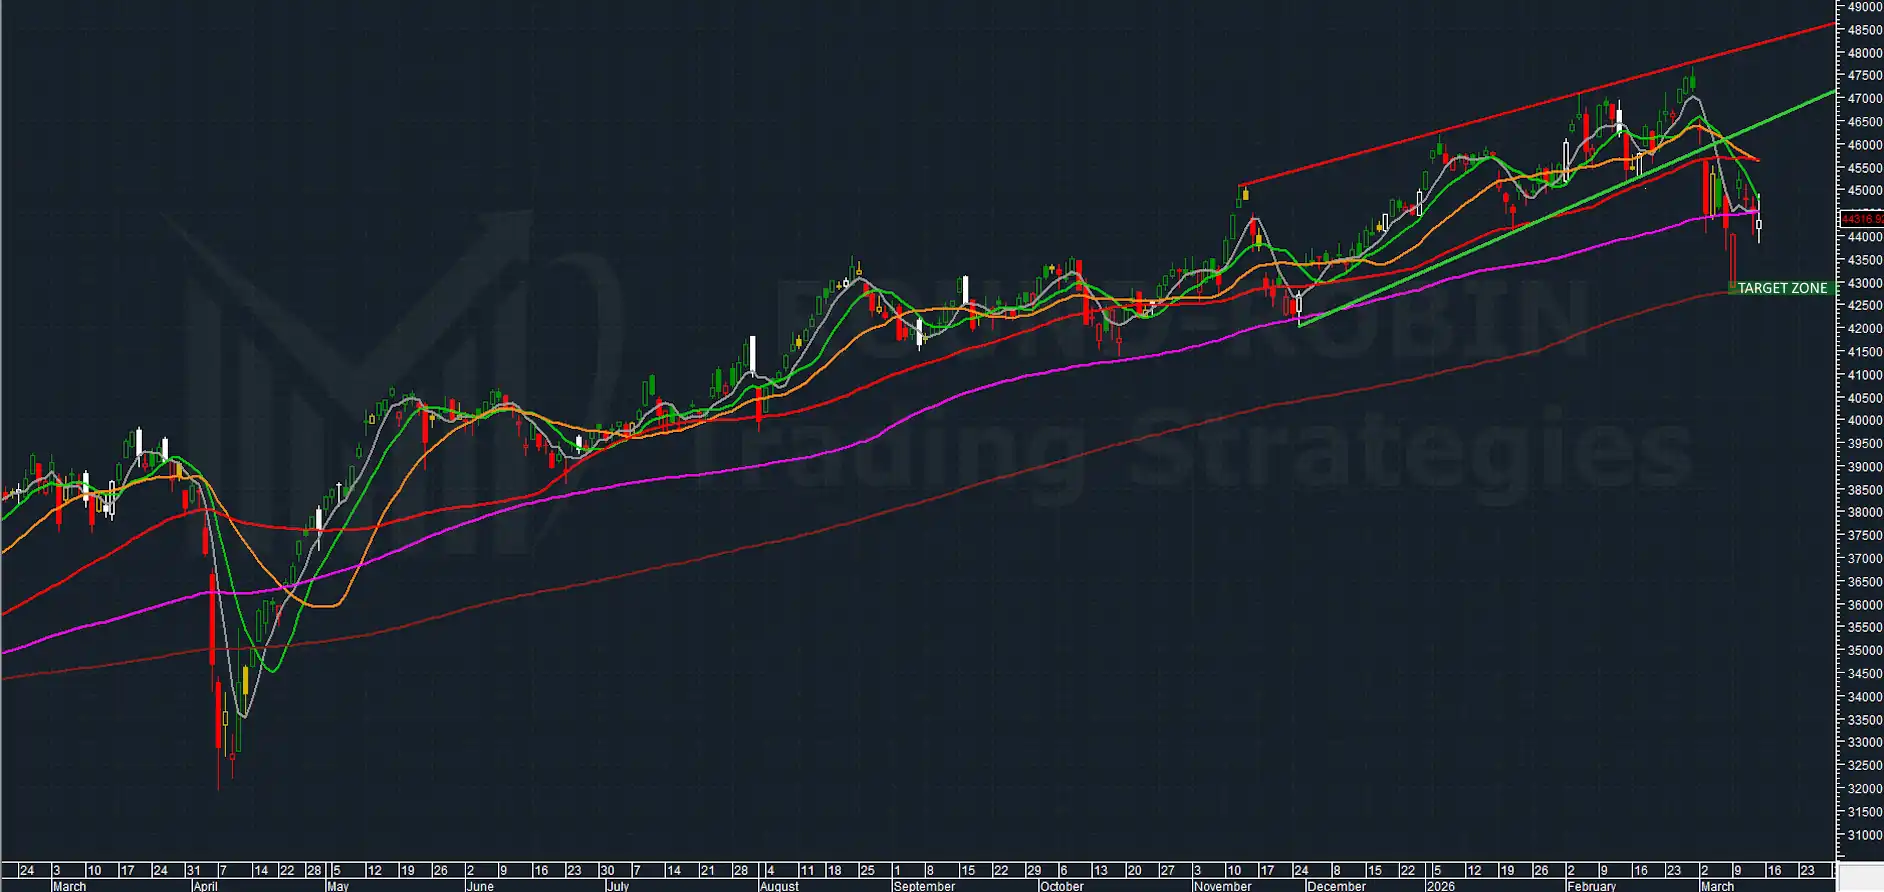
chart: FTSEMIB daily
A final note on the daily chart, which we update exclusively for educational purposes to complete the pattern flagged in Pattern Spotted.
We wanted to show that these patterns almost never pay off.
We caught a perfect one, which hit its target to the pip in under a week.
A win this time — but the statistics don’t change: this is a pattern to avoid unless backed by other supporting indicators.
Conclusion
The FTSE MIB short-term outlook remains bearish.
The expiration week will likely see some last-minute emergency short covering.
Bounces are possible, but more likely to remain contained within this week’s highs.
We remain bearish, targeting the MA50W.
A return to neutral or bullish bias requires weekly closes above the 45,500 area.
Soon only members will access this content. Subscribe free.
Leave a Reply