


Weekly appointment with the world’s most watched charts.
Last week the framework spoke. This week the market answered. The MA20W retested, rejected, and Friday on the lows. The analysis holds. Let’s dig deeper.
Bulls vs Bears
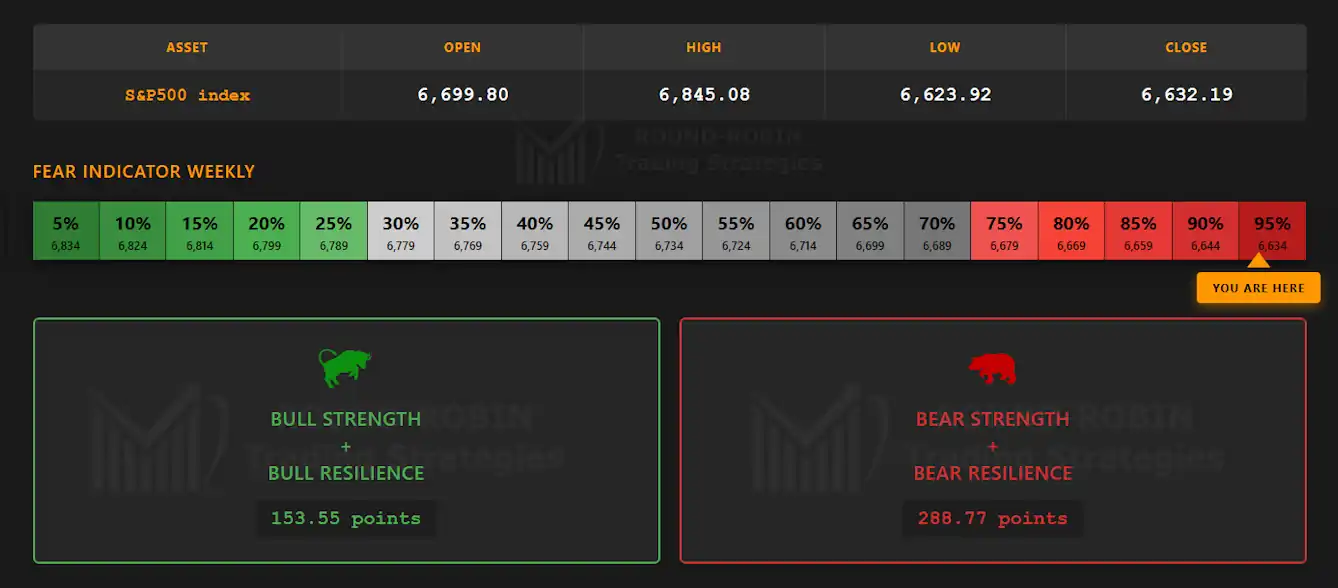
infographic: S&P500 index weekly – Bulls vs Bears
This week’s infographic shows a further shift in weight. Bear Strength plus Bear Resilience rise to 288.77 points against 153.55 for the bulls, a ratio of nearly 1.9 to 1. The Fear Indicator hits 90-95%.
The week opened with a gap down, then the market recovered. The close came on the weekly lows. The mid-week sigh of relief was false.
The Big Picture
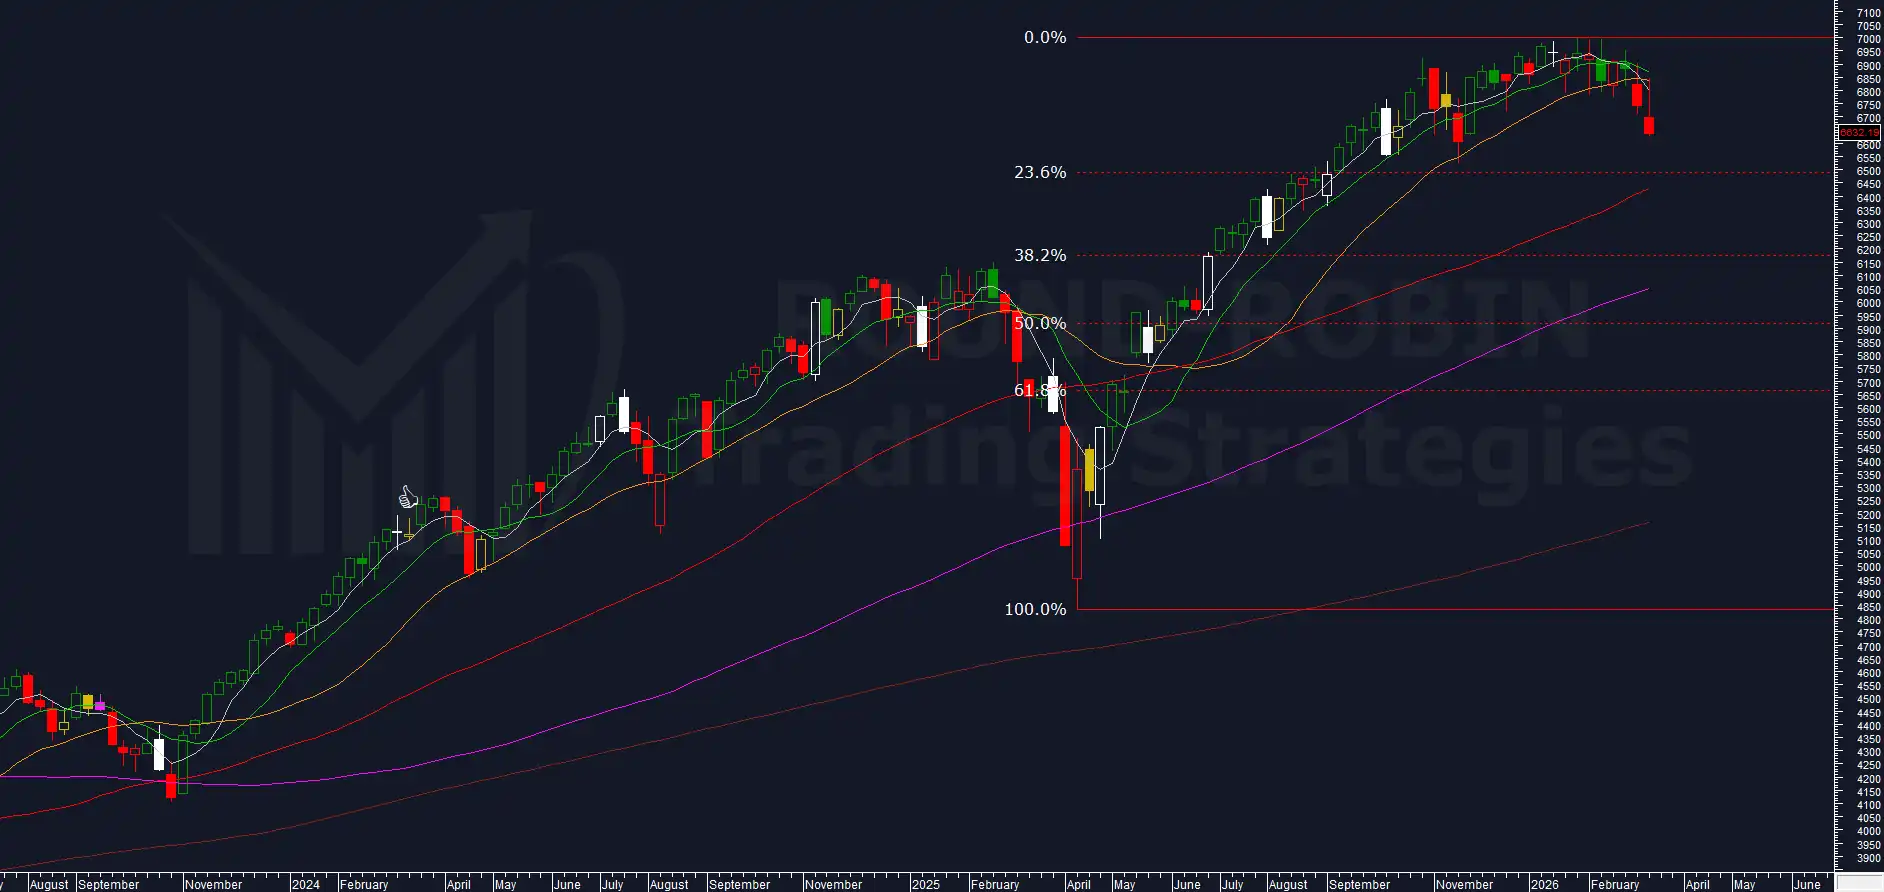
chart: S&P500 weekly
The market closed on the lows at 6,632.19.
After Monday’s gap down the price rallied back to the MA20W. The level that had guided every rally in this multi-year cycle — introduced as the key reference in our first analysis in W02 and examined in depth in the February deep dive — rejected the recovery attempt and closed the week sending prices to the low. The test failed. The confirmation came from the MA20W itself.
The MA5W has completed the bearish cross on the MA20W as well, having already done so on the MA10W. Something not seen in over 12 months. An indisputable trend switch on the technical plane. Last week we defined the trigger conditions. This week those conditions found confirmation.
Price targets on the chart:
- MA50W approaching the 23.6% retracement area, where the cross is expected.
- MA100W has started to round over, moving toward the 38.2% area, a relevant technical confluence zone.
- MA200W: the technical target of this cycle.
Worth noting that the 100% retracement of the move that started in April 2025 coincides with the 2025 low and with the 2022 high. An area to keep on the radar over the long term.
Volatility Indicator
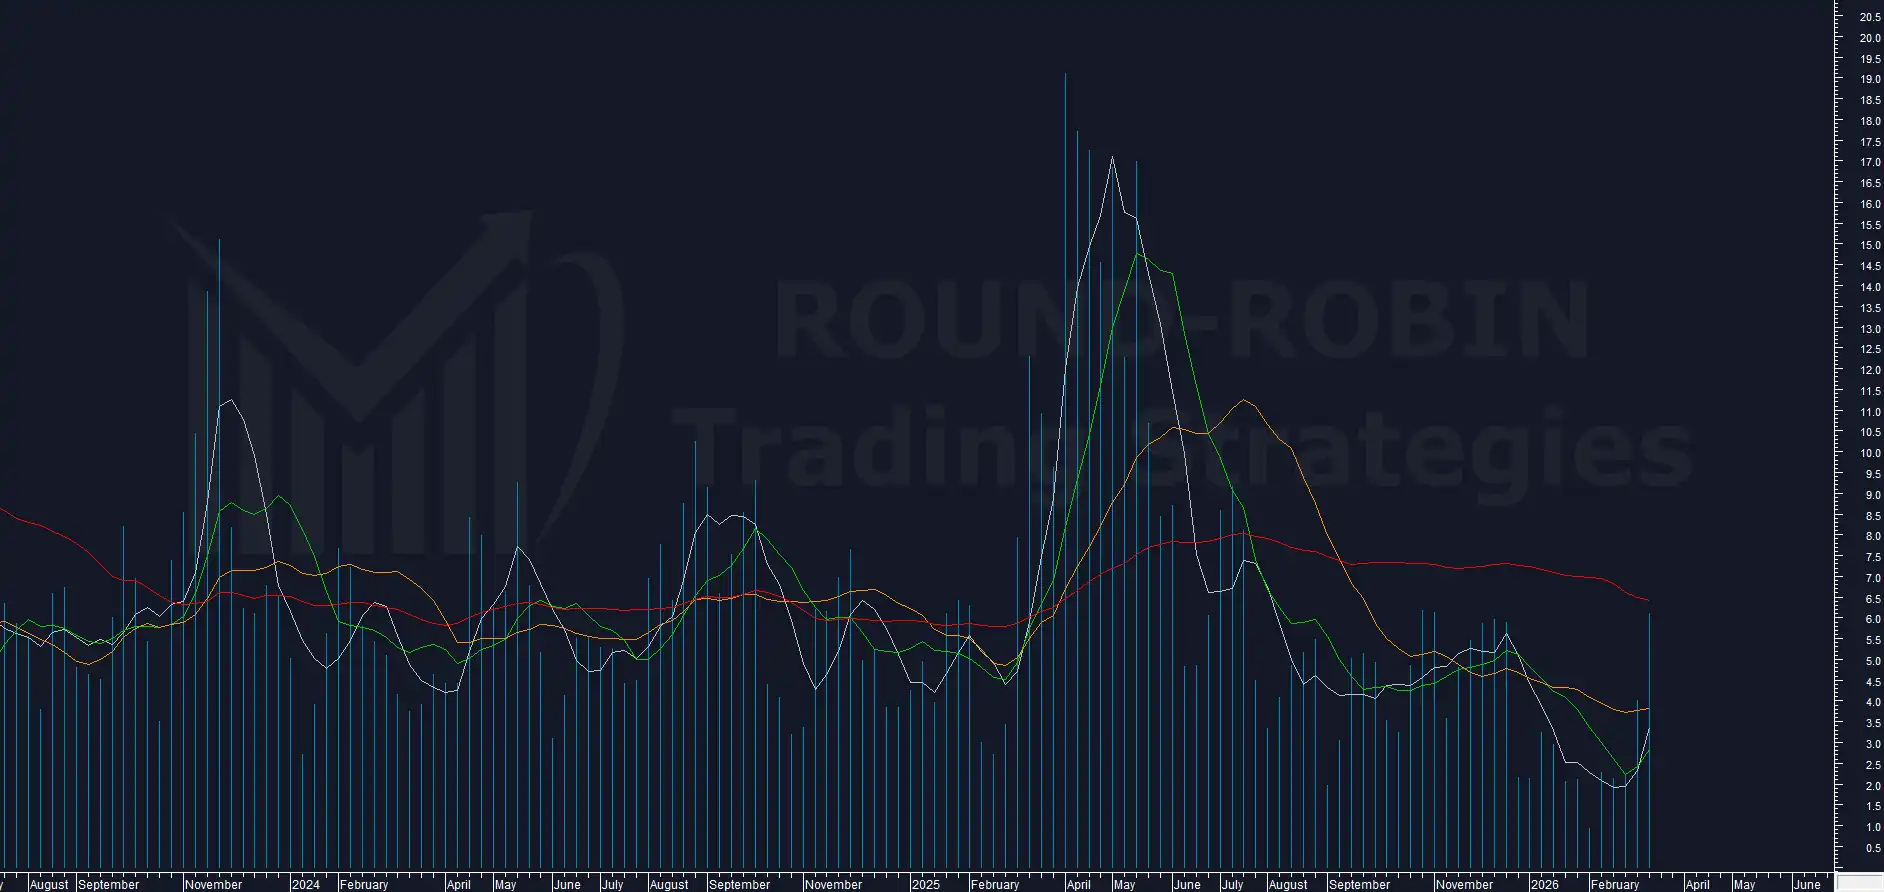
chart: S&P500 weekly – proprietary Volatility Indicator
The Volatility Indicator moves from 4.02% to 6.12%, approaching the October-November 2025 highs. Volatility is expanding. A further acceleration in the coming weeks would be consistent with the structure that is forming.
Range %
chart: S&P500 weekly – proprietary Volatility Indicator
3.34% this week against 2.84% the previous one. The internal dynamics tell more than the raw figure: gap down, mid-week recovery, close on the lows. The week has the shape of a failed test.
Overextension vs MA200W
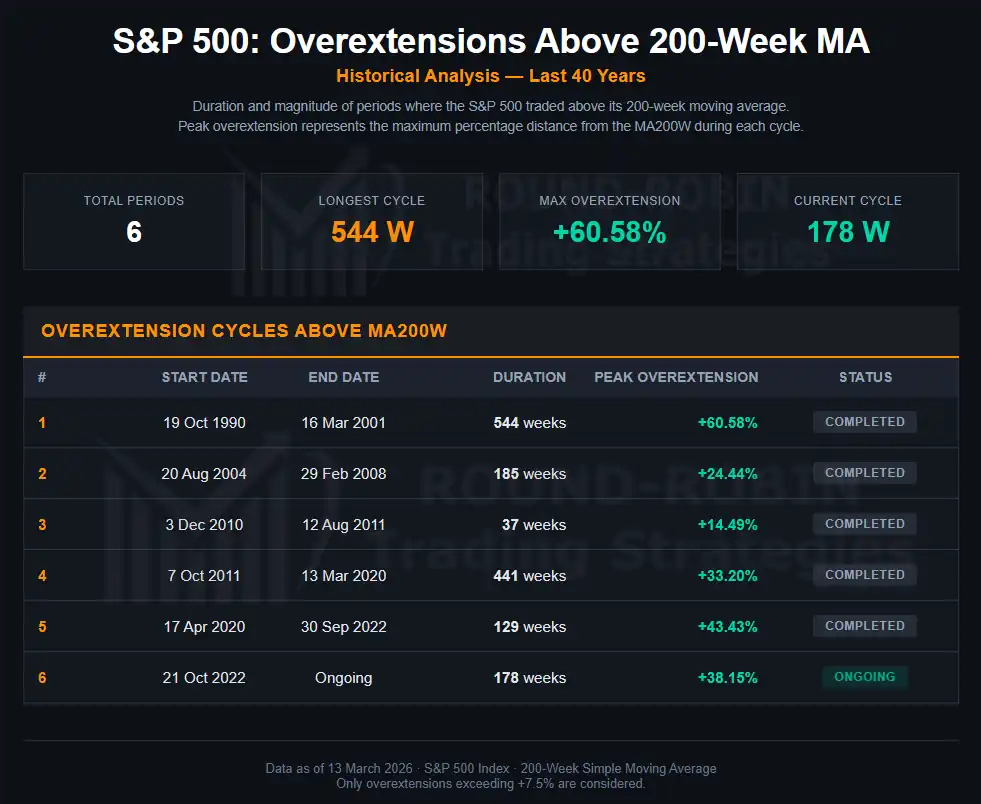
table: S&P500 Overextensions Cycles Above MA200W
Week 178. The overextension drops to 28.22%, below 30% for the first time. The MA200W rises to 5,165, approximately 10 points above the previous 5,152. The compression of the overextension continues, cycle after cycle, toward its historical reabsorption.
Conclusion
The MA20W was retested, erasing the poor Monday open. Once retested, it presented the bill to the bulls.
The week needed to certify that the medium and long-term bearish trend is unstoppable has not arrived yet. It could be the next one. All the elements are in place, including the quarterly technical expiration, the triple witching, which historically can generate accelerations that very few are currently pricing in.
In markets anything is possible, including a rally that puts the bears on the defensive. Current data make this scenario unlikely. If it happens, that is what money management is for.
Soon only members will access this content. Subscribe free.
Leave a Reply