


Pattern Decoded is our Monday format where we cover the most well-known patterns in technical analysis. This week we talk about Gaps—the unfilled intervals on a price chart where no trading occurs.
Pattern Decoded: The Gaps
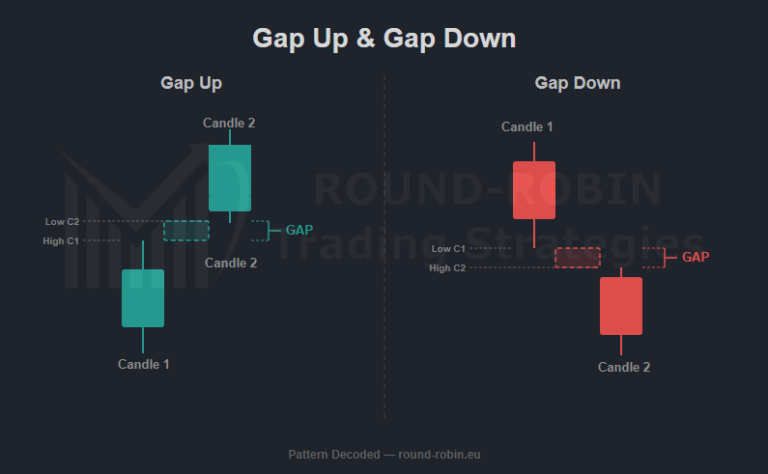

Pattern Decoded is our Monday format where we cover the most well-known patterns in technical analysis. This week we talk about Gaps—the unfilled intervals on a price chart where no trading occurs.
Weekly appointment with the world’s most watched charts.
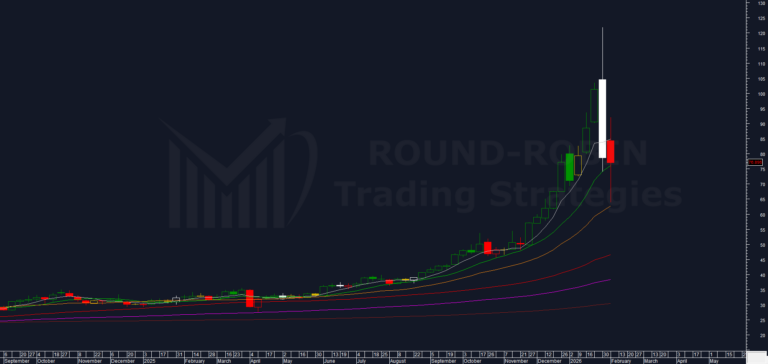
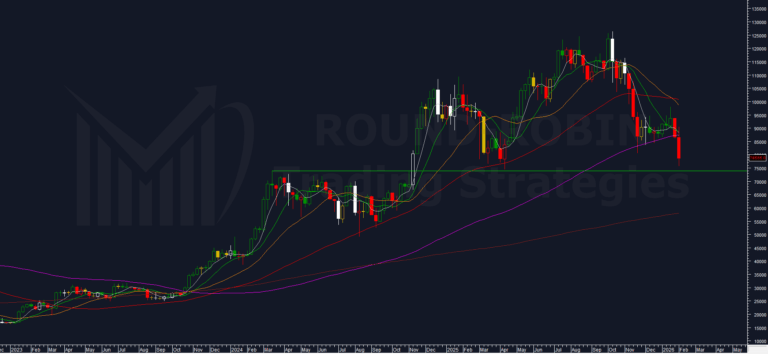
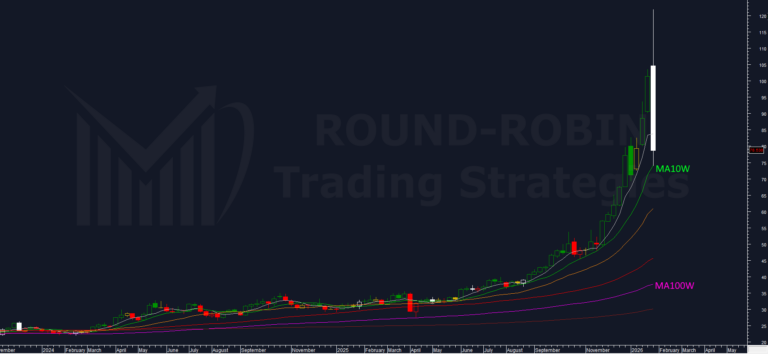
This week, the gold medal for Chart of the Week has been amply earned by Bitcoin.
Between desperate influencers preaching “the more it drops the better, smart money buys the dip,” haters who can’t wait to see BTC go to zero, we position ourselves in the middle—or rather far to the side, to avoid contamination—and try to show what the numbers say, without any bias.
We’re not fans.
We stand—we try to stand—with whoever wins.
If you’re a permabull or a permabear, don’t continue reading.
This isn’t for you.
Quick observations on charts that caught our attention this week.
We must restart from where we left off last week in our deep dive on Silver.
The assumption remains the same as in our first post when Silver was above $100: the epic rallies will be wiped out completely.
We said: trading Silver right now, in any direction, is a lottery.
Just sit and wait.
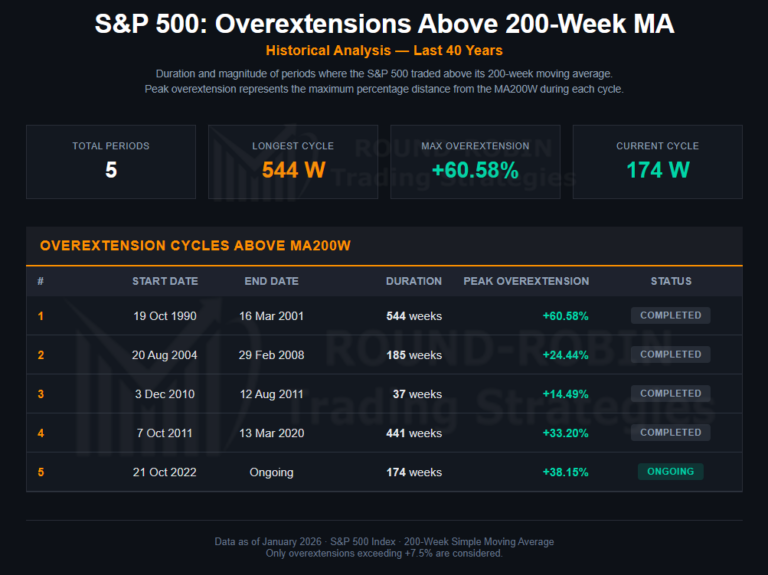
This week’s deep dive is dedicated to the S&P 500.
We’ve been tracking this setup since W02 — and the framework still holds.
An analysis of the key technical indicators and historical patterns that guide our market reading.
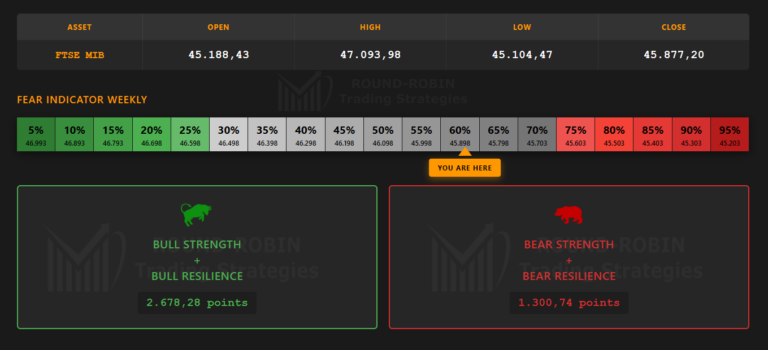
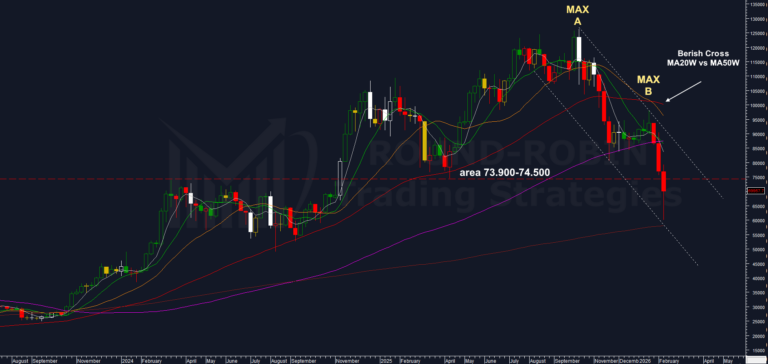
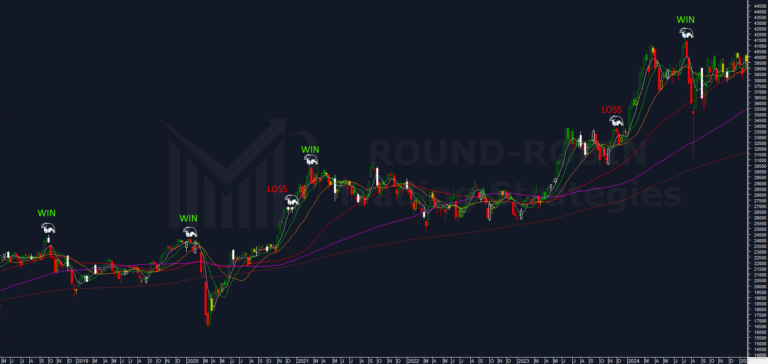
Weekly tracking of the Italian benchmark index. Why do we do this? Check out our strategy page.
My proprietary DBBT indicator identifies misalignments between current price and expected technical levels on major indices.
Every week, we put the FTSE MIB in our crosshairs.
The hunt is on.
Pattern Spotted is our format where we analyze patterns and configurations as they appear in the markets. This week we discuss the Bearish Engulfing on Brent and Nikkei.
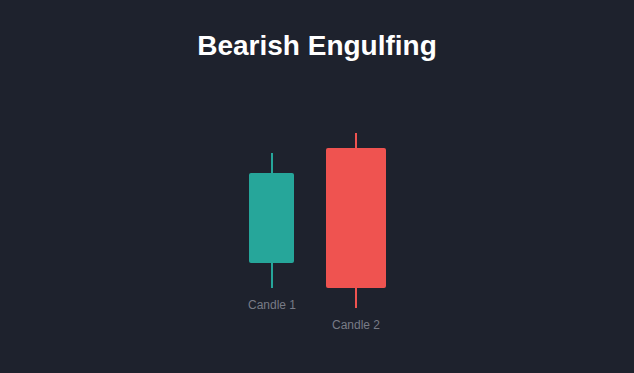
Pattern Decoded is our Monday format where we cover the most well-known patterns in technical analysis. This week we talk about Japanese candlesticks and the Bearish Engulfing.
Quick observations on charts that caught our attention this week.
This week’s flash is a follow-up to last week’s Bitcoin analysis. The parallel with 2022 wasn’t just a parallel — it played out.
It doesn’t happen very often — a -31% day on an asset as well known as Silver. Not over a week. Not over several sessions. One day. A few hours.
This article retraces what we identified, what we proposed, and what actually happened. Not to celebrate being right. To understand the mechanics of what just occurred — and what comes next.
Chart of the Week — Week 3 2026
If you need to know what to do right now, skip to the Conclusion.
Short version: don’t touch Silver. In any direction. The rest of this article is the explanation.