


Quick observations on the charts that caught our eye this week.
This week’s flash covers EUR/USD, Brent Crude Oil, Bitcoin, S&P 500, DAX and Nikkei 225. Gold and Silver remain flat with no relevant changes and are not updated. EUR/USD prints a large bullish candle clearing the MA50W, MA10W and MA20W in one shot. Brent is violently rejected from the weekly high with the range back above 23%, closing near the MA10W. Bitcoin moves back above the MA10W with the cross on the MA20W, but the range remains tight: the compression continues. The S&P 500 produced a textbook swing from the MA50W closing above the MA20W, recovering in one week the negativity of the previous three. The DAX loses momentum after the rally from the MA100W. The Nikkei 225 explodes with a massive bullish candle, comfortably surpassing the target from our Chart of the Week last week: all-time highs are now in sight.
Let’s go into a bit more detail and try to figure out what lies ahead for next week.
⚡ EUR/USD
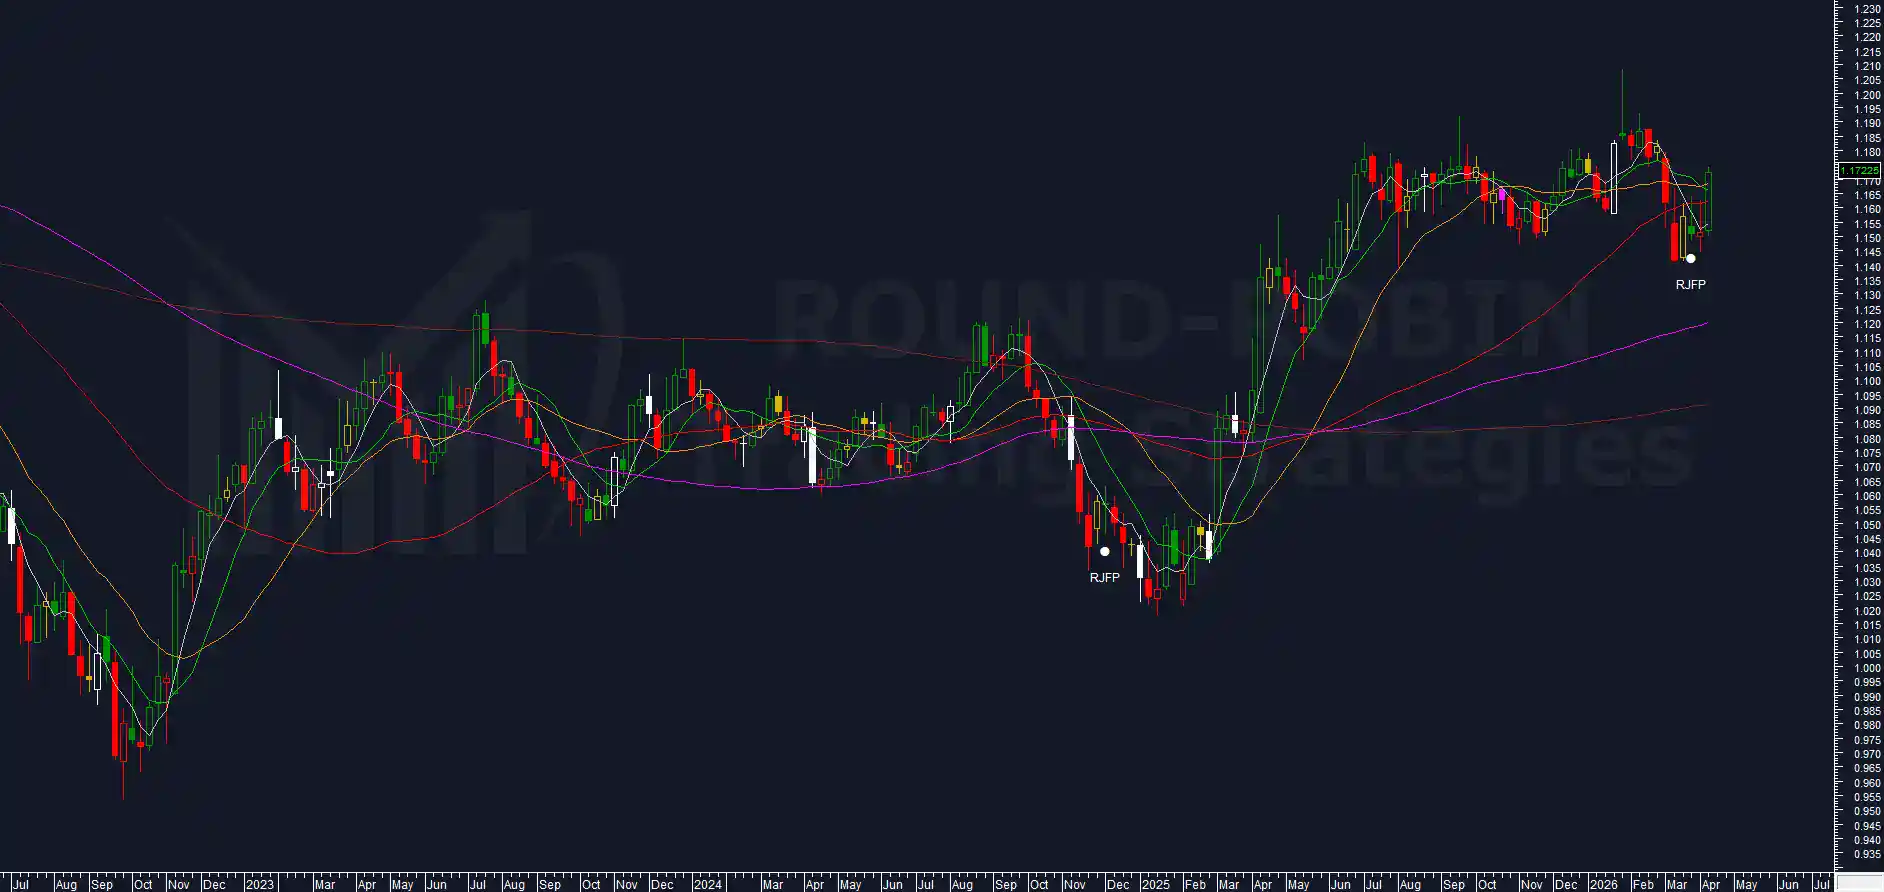
chart: EURUSD weekly
Large bullish candle with rising highs and lows. Prices cleared the MA50W, MA10W and MA20W in one shot, closing the week at 1.17220.
The stop loss on our RJFP short was set on a weekly close above the MA50W and 1.164. The break is clean and leaves no room for interpretation.
Unlike its last appearance, in late 2024, where it had correctly identified the pace and direction of the bearish continuation, this time the RJFP failed to identify the continuation of the move. The pattern has failed.
The break is clear but not sufficient for a reverse. The system closes the short and goes flat.
For the detail of the RJFP signal and the context from previous weeks, see Charts Flash Week 14 and Charts Flash Week 13. For the full EUR/USD framework, see our Chart of the Week and the original King of Shooting Stars pattern study.
⚡ BRENT CRUDE OIL
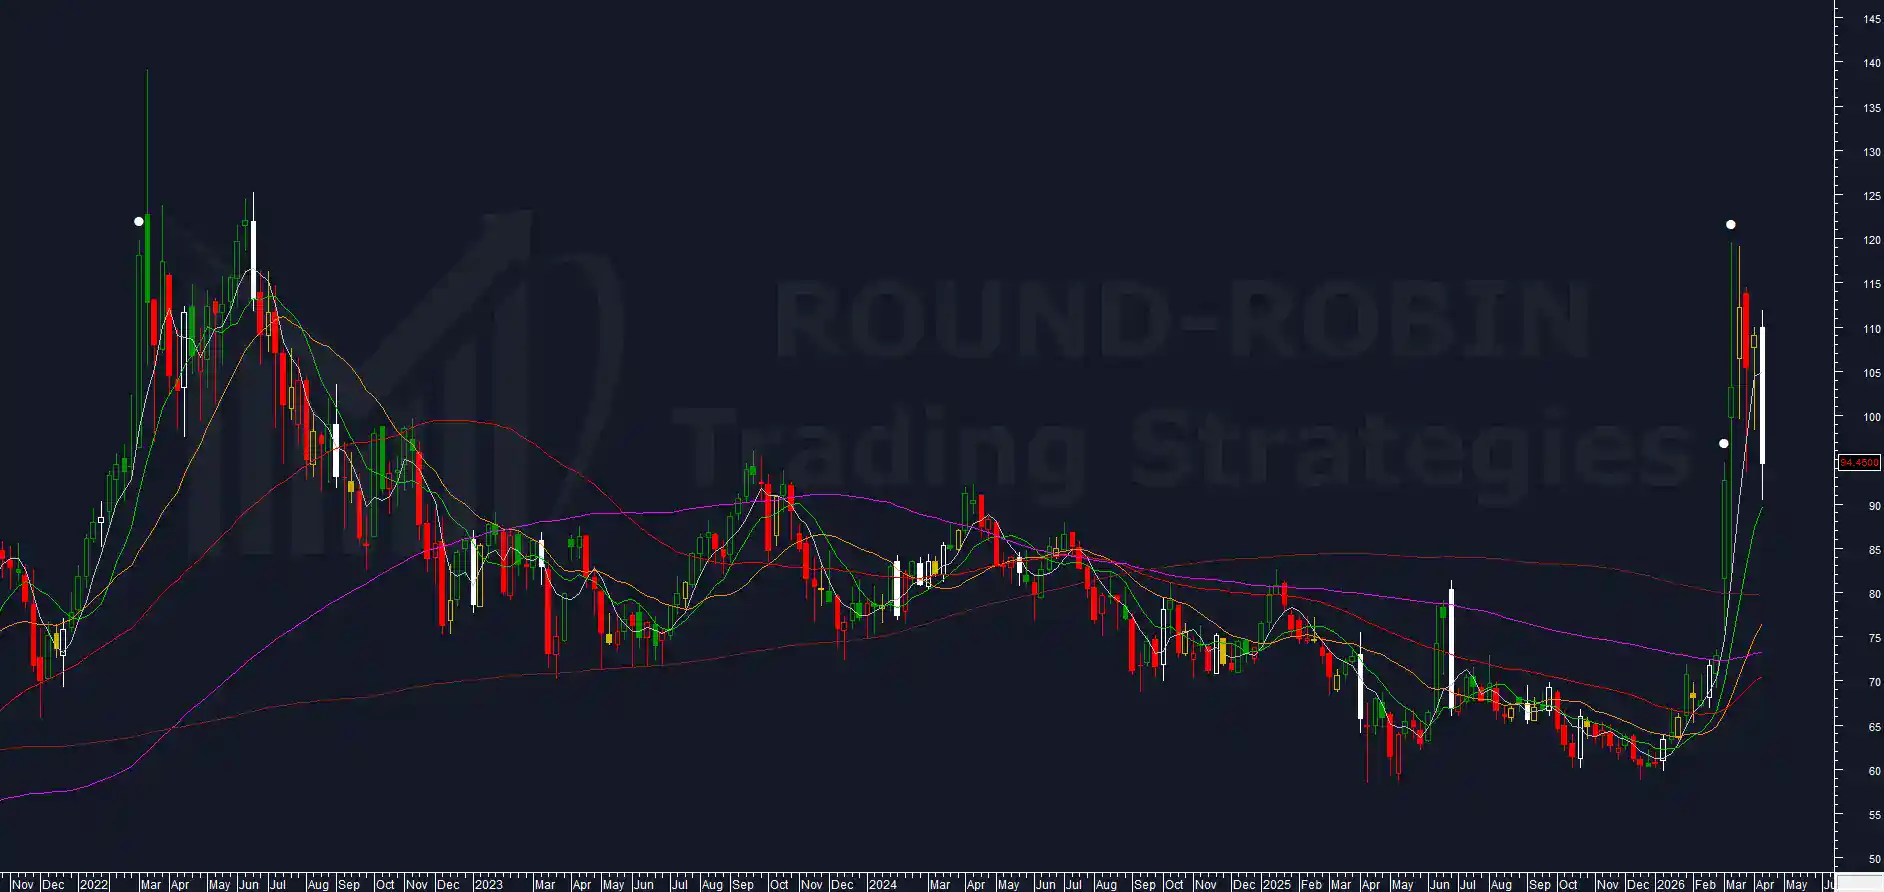
chart: Brent Crude Oil weekly
Violent rejection from the weekly high at 111.89 down to 94.04 near the MA10W, where prices bounced closing at 94.45, above the low from two weeks ago at 93.45.
The range spiked again to 23.77%, while our proprietary volatility indicator is stable at 25.68%.
The position remains short but came very close to the exit trigger. If bearish momentum is not confirmed next week, the exit becomes inevitable.
For the full signal detail, indicators and operational levels, see our Chart of the Week Week 13 and Charts Flash Week 14.
⚡ BITCOIN
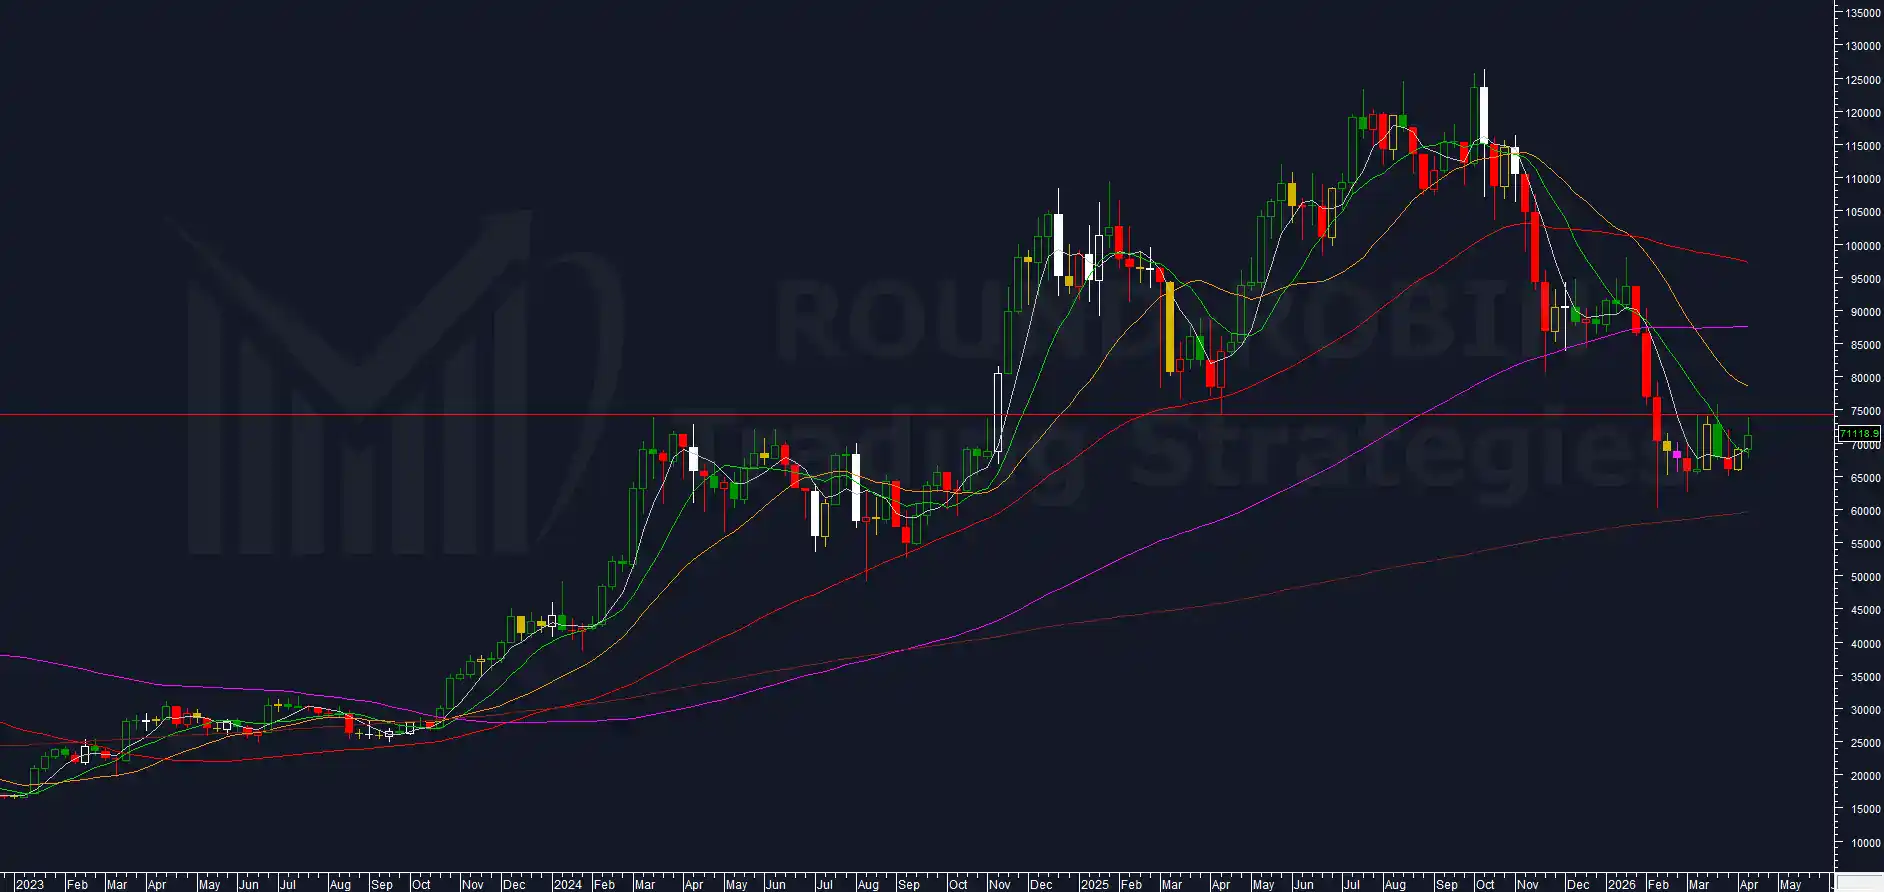
chart: Bitcoin weekly
Last week we wrote that in the most recent cases, range collapses of this nature have led to one final bullish spike before the dump. The spike arrived, but the rally went beyond values that can be considered optimal for a bear position.
At the time of writing, Bitcoin trades at 71,117, close to the 72,000-75,000 band beyond which the stop loss would trigger. Prices have moved back above the MA10W and the MA10W has crossed above the MA20W. The range remains tight, with no extreme values.
There is no exit trigger yet, but if bearish reaction fails to materialize next week, the exit becomes practically inevitable.
For last week’s update and the full breakdown of levels and scenarios, see our Charts Flash Week 14 and Bitcoin Chart of the Week.
⚡ S&P 500
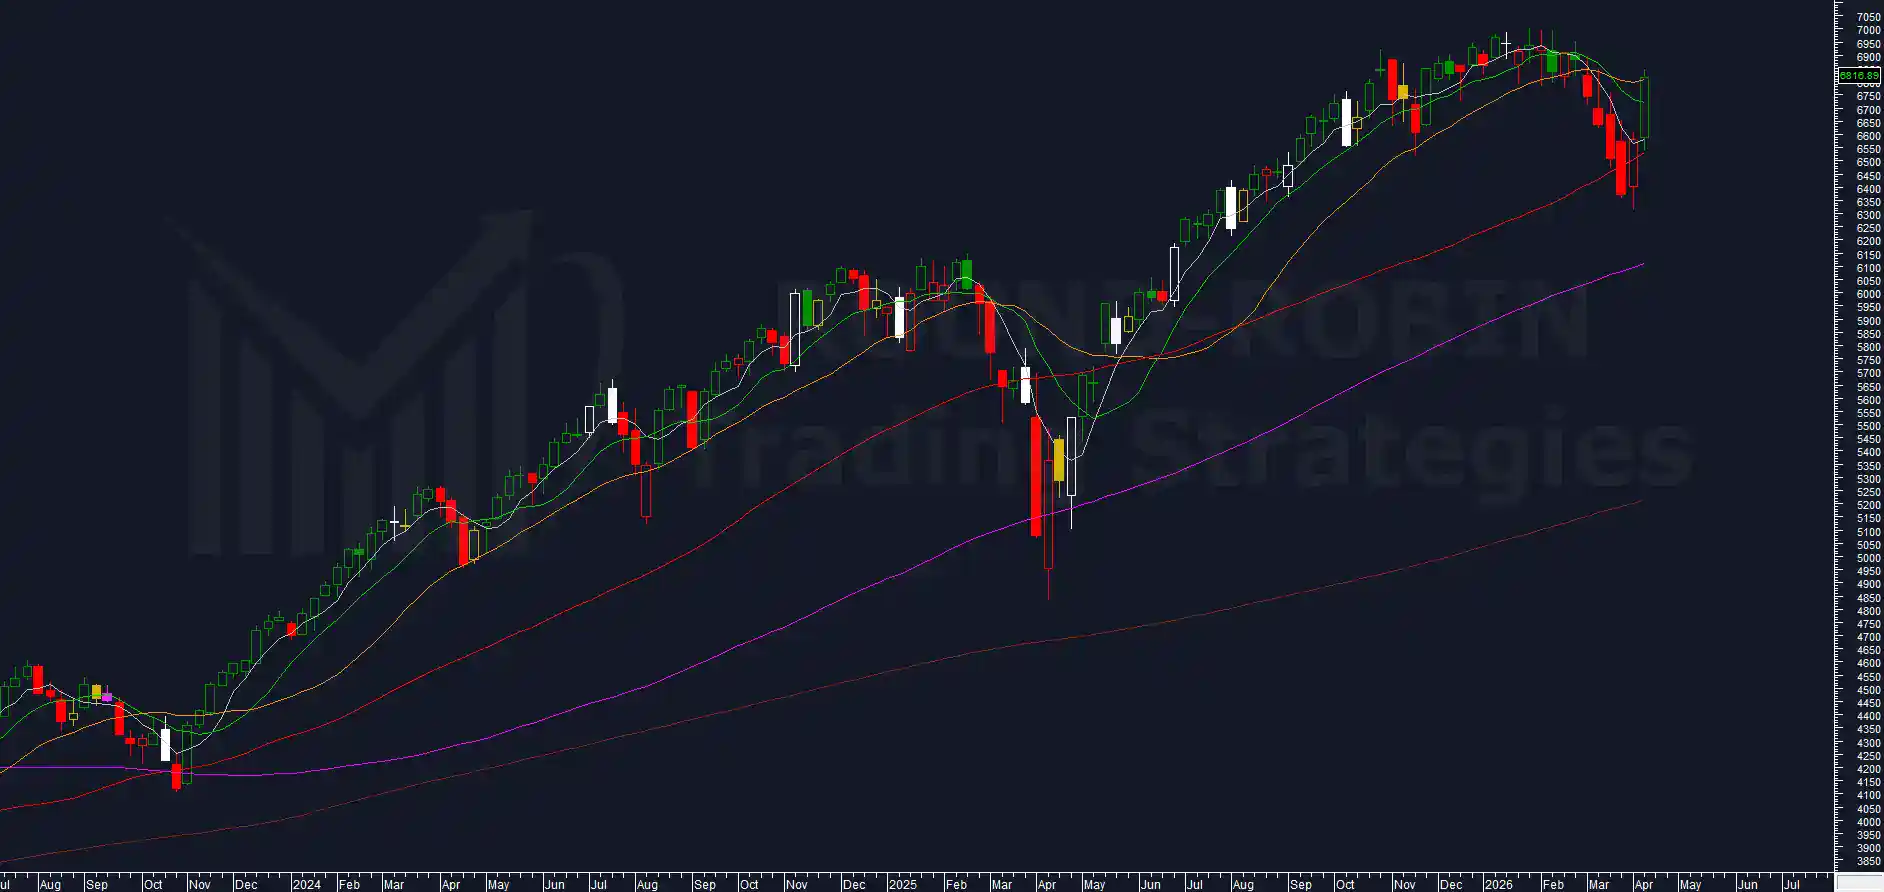
chart: S&P500 weekly
Textbook swing. Low at the touch of the MA50W and close fractionally above the MA20W. Weekly close at 6,816.69. Three weeks of negativity recovered in one.
Historically, a configuration with a wide range and body recovering from a relative low manages to deliver a small continuation of the move, but not to extend it immediately beyond the period highs. The expectation is therefore for a toppish phase.
The system remains flat awaiting new signals.
For last week’s update and the full S&P 500 framework, see our Charts Flash Week 14, the Chart of the Week Week 11, the February Deep Dive and the original W02 analysis.
⚡ DAX
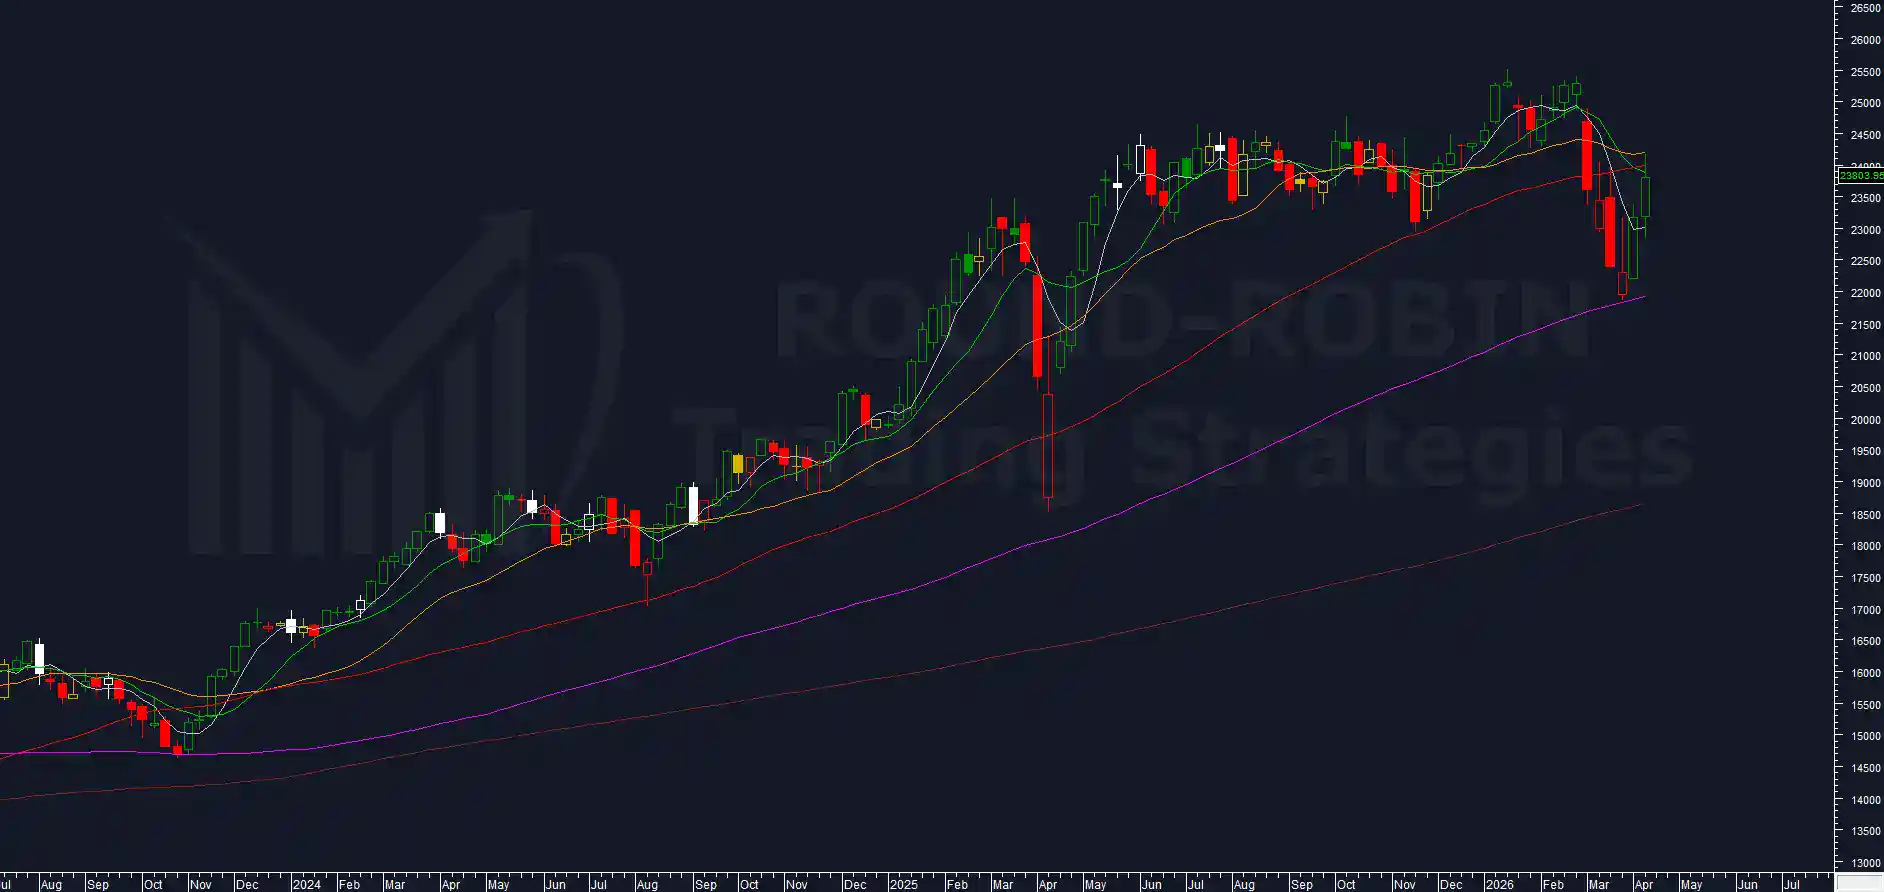
chart: DAX weekly
Exit long. After the rally from the MA100W, the DAX could no longer find the strength to recover the MA50W and the MA20W. The MA10W was also lost at the end of the week. Weekly close at 23,803.95.
The week remains positive despite the rejection from the mentioned averages. The range stays reasonably high, just below 6%.
The loss of momentum, however, did not allow the trade to be kept in the portfolio.
The system goes flat.
For last week’s update and the trade context, see our Charts Flash Week 14 and Charts Flash Week 13.
⚡ NIKKEI 225
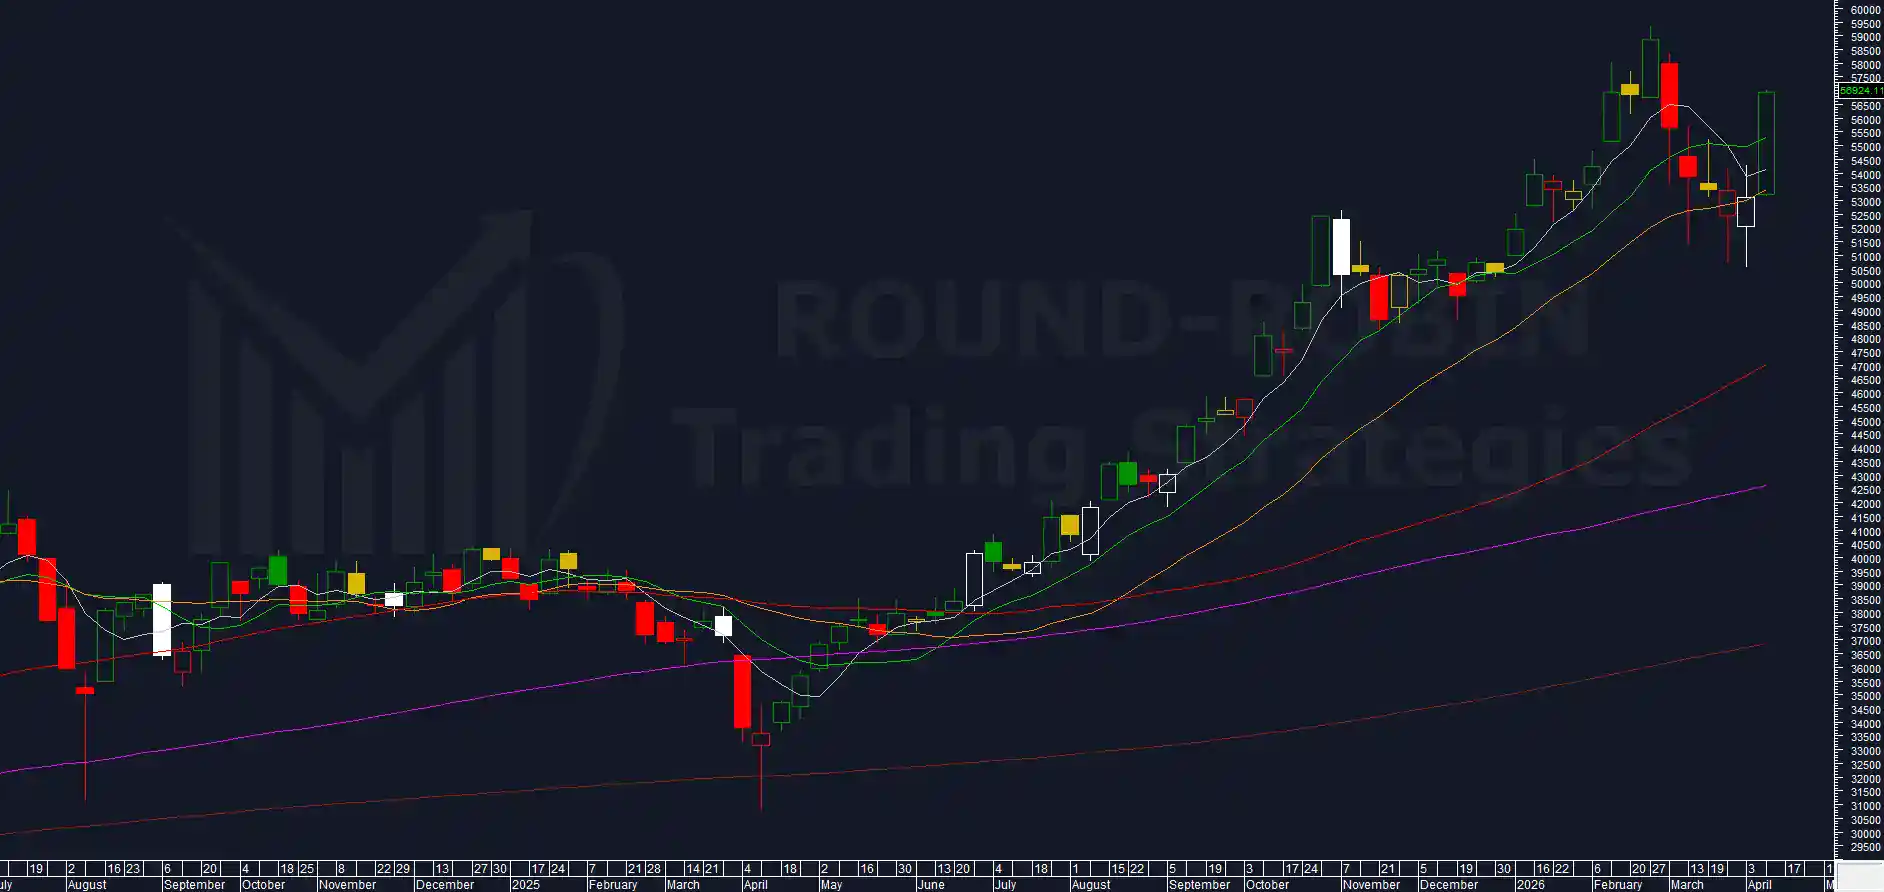
chart: NIKKEI weekly
Massive bullish candle. The weekly low matches the previous week’s close, and the close at 56,924.11 comes just below the weekly high at 57,012.77. A virtually perfect trade.
The 56,000 target indicated in our Chart of the Week last week has been comfortably surpassed. All-time highs are now in sight.
The system remains long. Eyes on momentum, which for now remains strong. The overextension on the MA200W is back to 44.20% but remains well below levels where a reversal can be expected as in the previous month.
For the full trade detail, overextensions and framework, see our Chart of the Week Week 14 and the original March analysis.
Leave a Reply