


Quick observations on the charts that caught our eye this week.
This week’s flash covers EUR/USD, Brent Crude Oil, Gold, Silver, Bitcoin, S&P 500 and DAX. EUR/USD at its third consecutive week of testing and rejection from the MA50W, the attempt to recover the MA5W failed, the short remains intact. Brent, featured in our Chart of the Week last week, continues as an inside candle with volatility and range declining sharply but still elevated: the system remains short. Gold and Silver stay neutral, both with rising highs and lows but without a weekly price signal to justify re-entry. Bitcoin unchanged, compressed below the MA10W for the third consecutive week with a sharply contracting range. The S&P 500 closes short positions on loss of momentum, simultaneously recovering the MA50W and MA5W with one of the most extended bullish bodies in a year. The DAX confirms the long with nearly +900 points on the week, rising highs and lows and recovery of the MA5W.
This is not meant to be a full analysis – just food for thought on a few charts that caught my attention this week.
⚡ EUR/USD
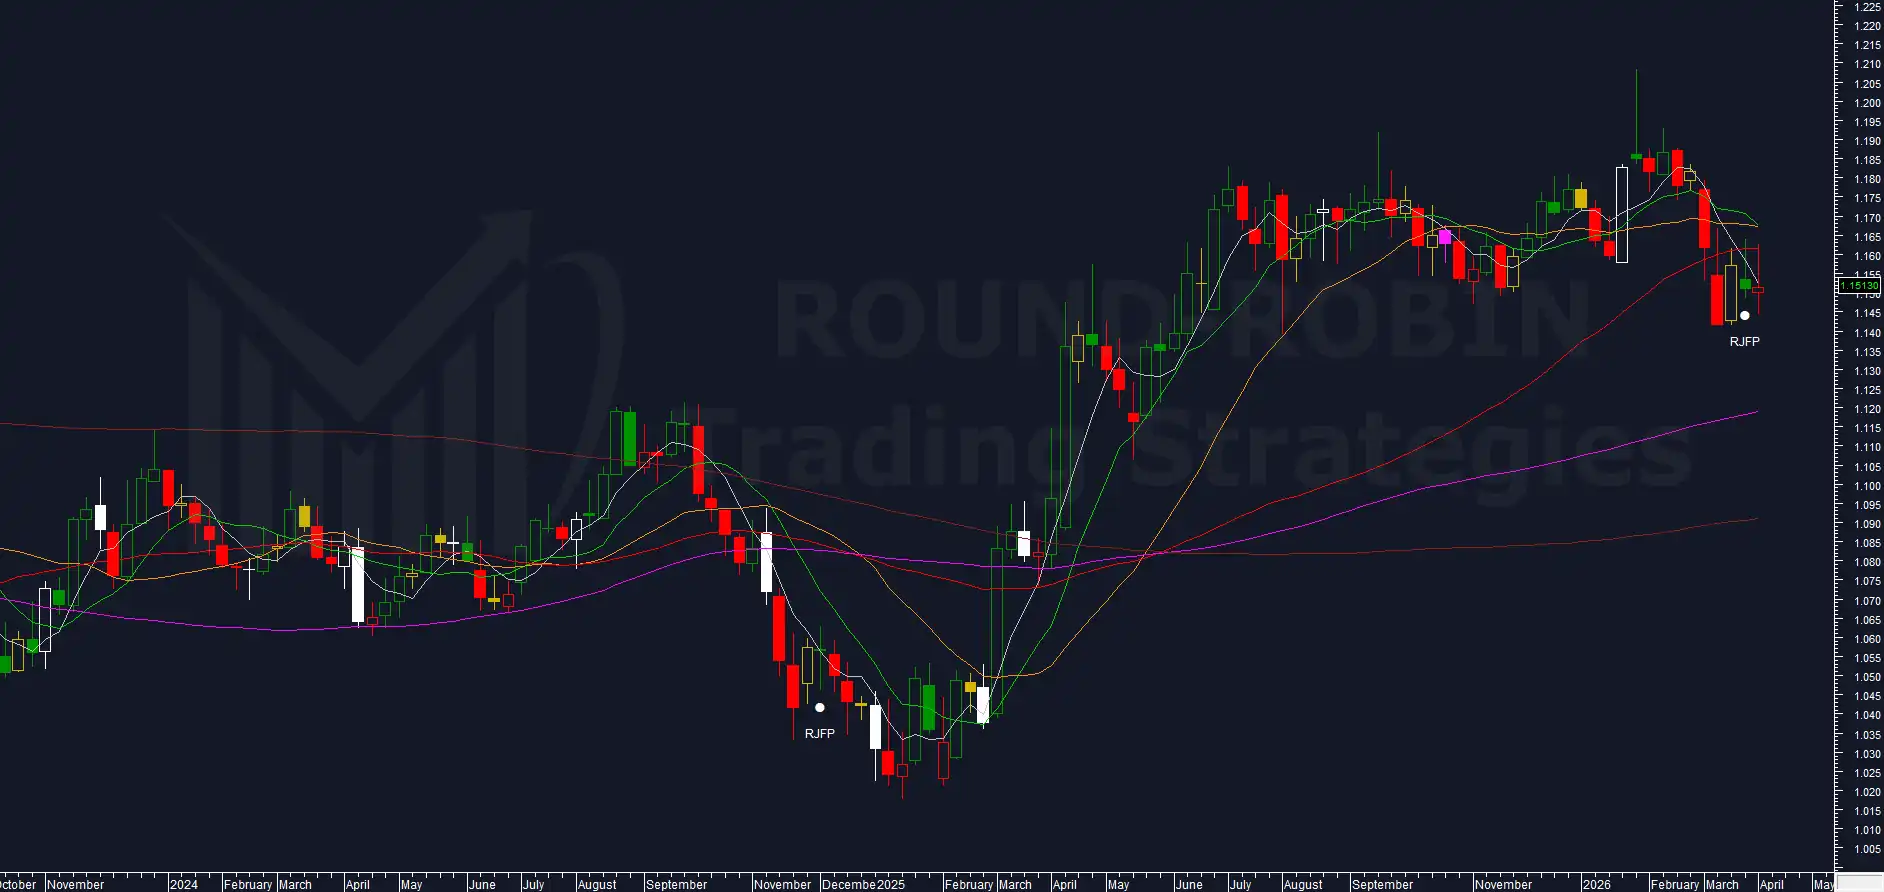
chart: EUR/USD
Third consecutive week testing the MA50W. Third rejection. The pattern is clear in its repetition, but unconvincing in its execution: there is no real price signal, just a resistance that holds.
The attempt to recover the MA5W also failed. Prices pushed as high as 1.16271 during the week, only to close at 1.15130, practically where they opened.
Our algorithm remains short. For the implications of this configuration and the detail of the RJFP signal, see our Charts Flash Week 13.
For the full EUR/USD framework, see our Chart of the Week and the original King of Shooting Stars pattern study.
⚡ BRENT CRUDE OIL
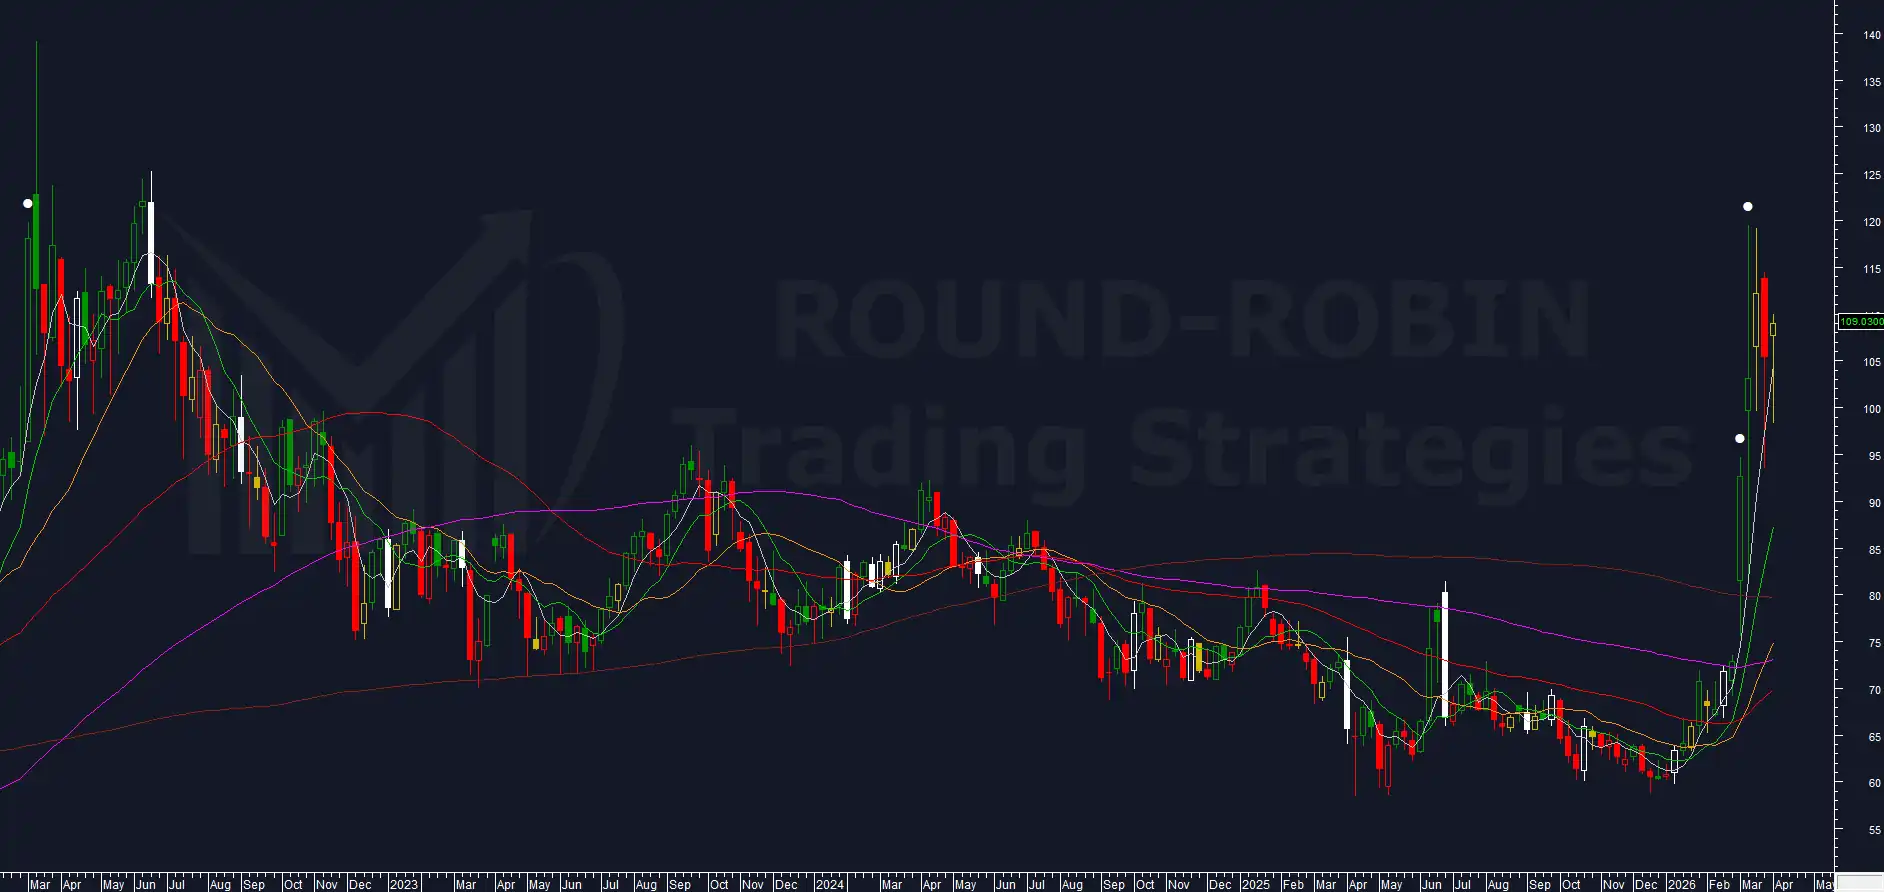
chart: Brent Crude Oil
Volatility and range continue to decline: this week’s 11.83% is a sharp drop from the previous week’s 22.45%, but it remains well above long-term averages.
The week closed with a long lower shadow. The low broke the MA5W during the week but recovered it at the close, exactly as it did last week. Prices closed slightly above where they opened. The candle is, for the second week out of three, an inside candle.
Our algorithm remains short. The position is currently at a loss: the system has not factored in either the gain or the loss recorded during the week, treating them as noise.
For the full signal detail, indicators and operational levels, see our Chart of the Week Week 13 and the Charts Flash Week 13.
⚡ GOLD
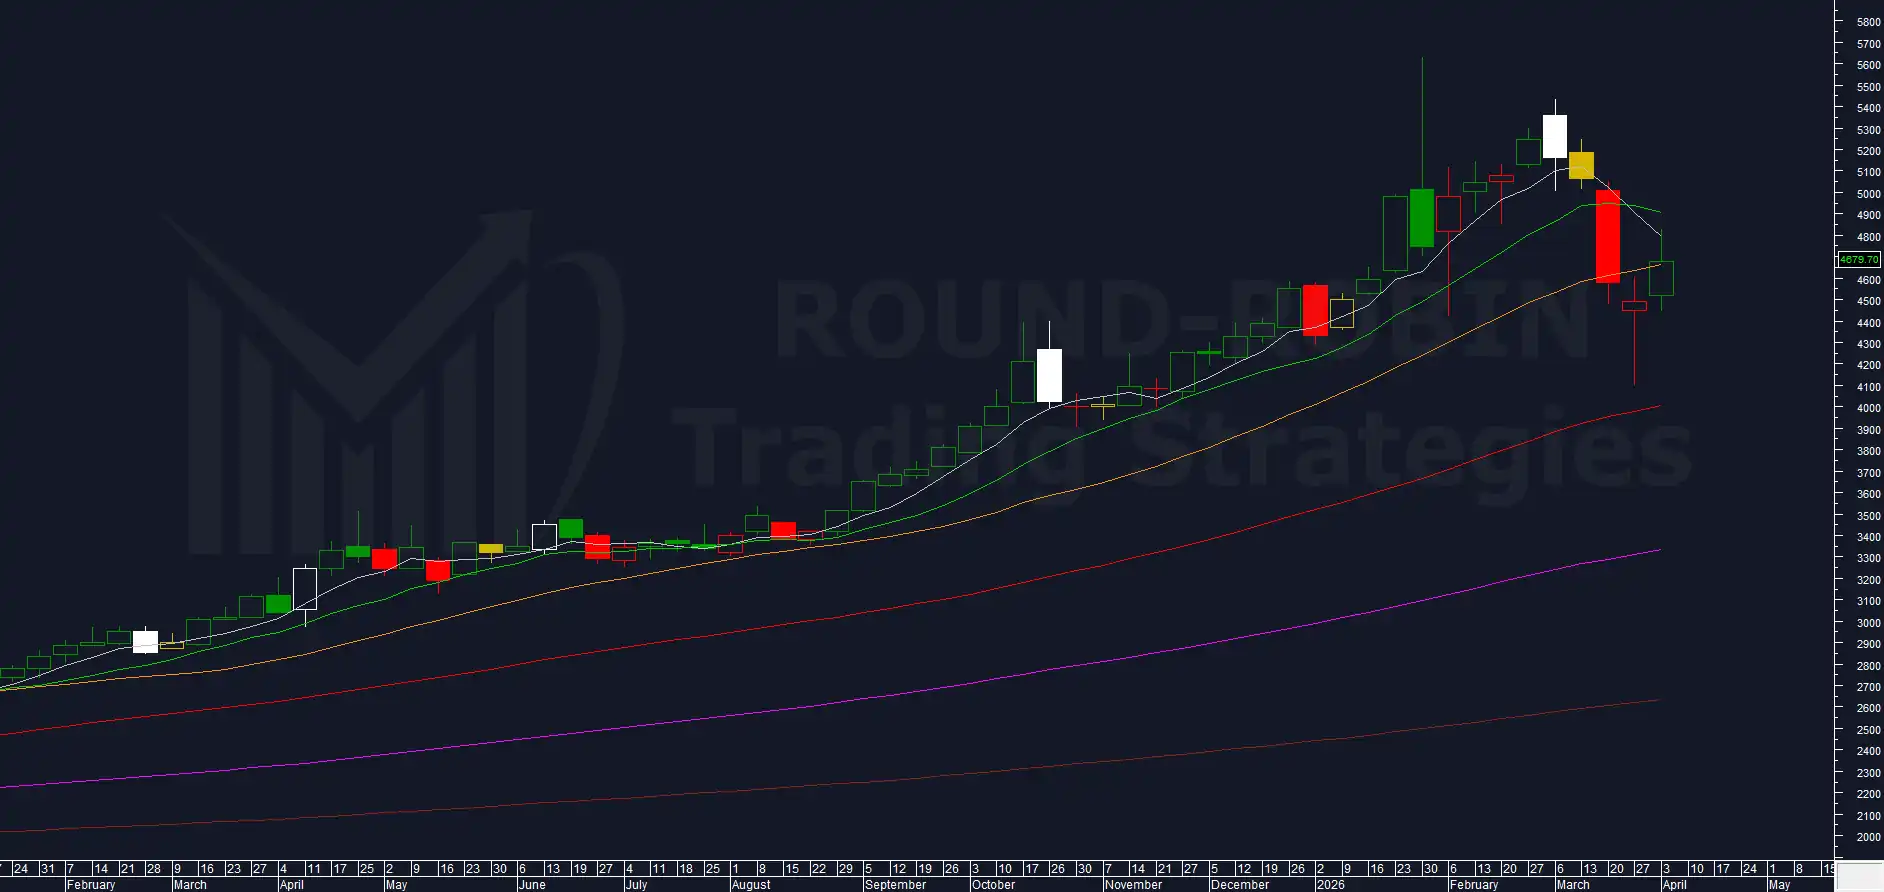
chart: Gold weekly
Our system remains neutral. Rising highs and lows, a small body with close above the open. Weekly close at 4,679.70.
The MA20W was recovered, by just a few points, and the MA5W rejected price. Volatility remains high but is not being expressed directionally.
A weekly price signal accompanied by the volatility is needed for our system to re-enter the market.
For last week’s update and the full framework, see our Charts Flash Week 13 and the Volatility + RSI countdown.
⚡ SILVER
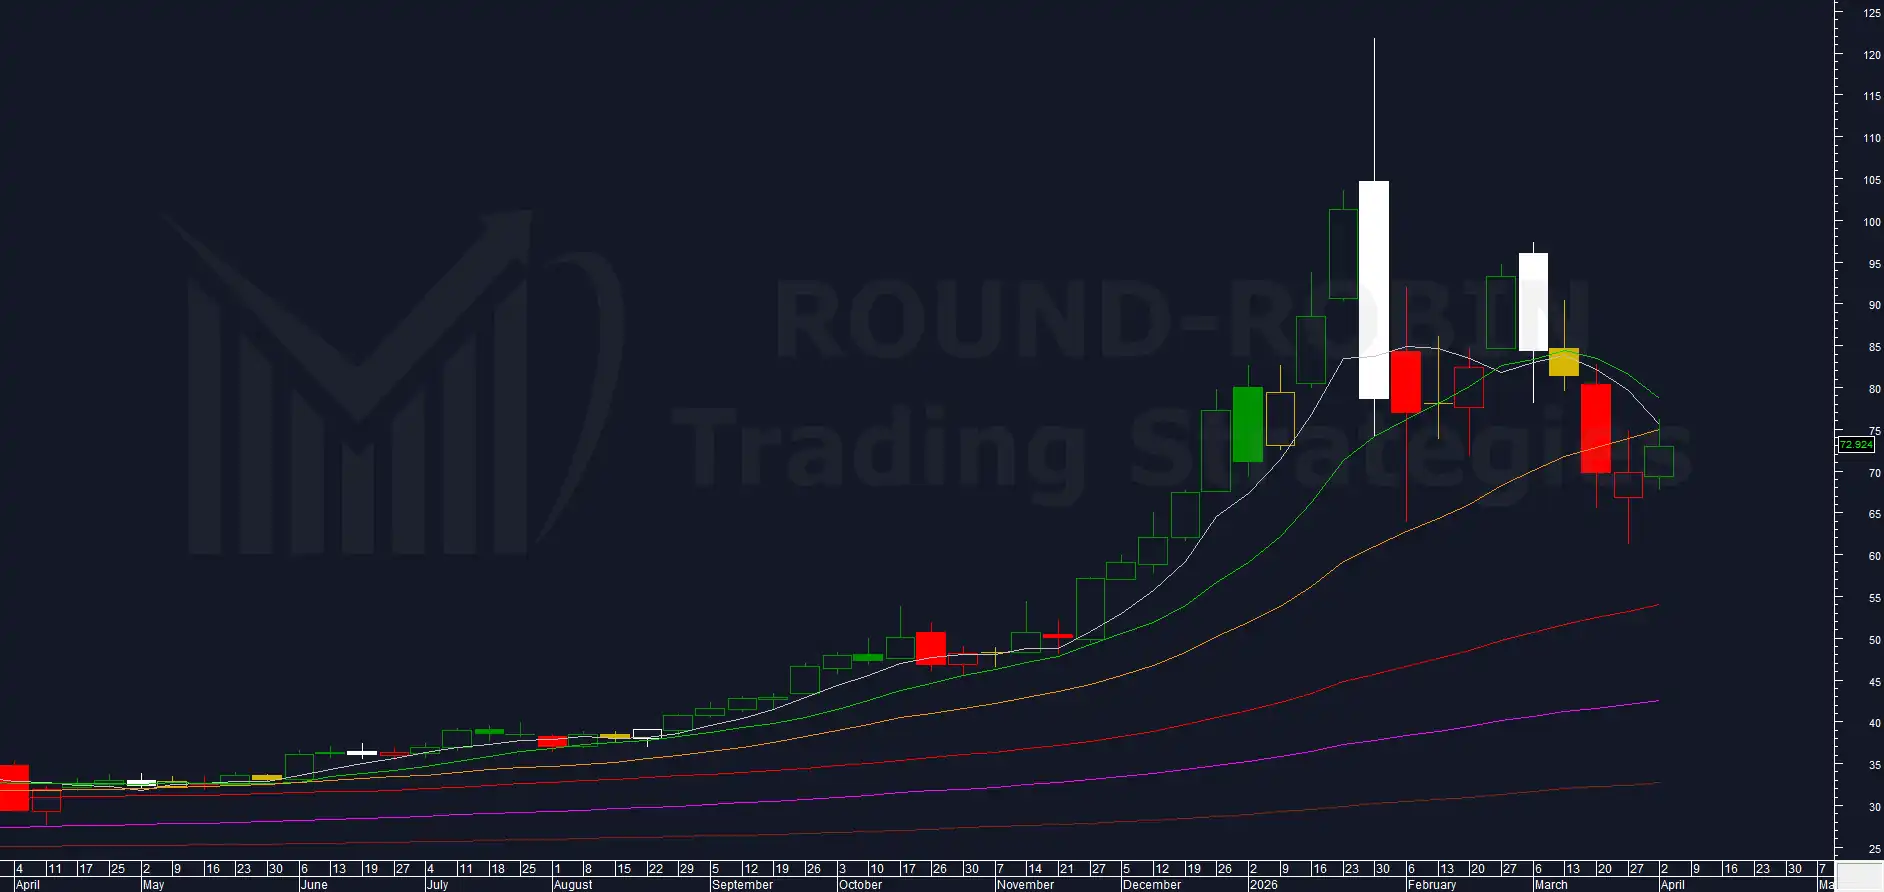
chart: Silver weekly
Our algo remains neutral. Rising highs and lows, but slightly rejected from the MA20W. Weekly close at 72.925. Technically nothing changes.
The level to watch is the weekly low. Declining highs and lows next week could be sufficient to trigger a new short. Conversely, a continuation of the bounce could lead to a short-term long.
For last week’s update and the full Silver thesis, see our Charts Flash Week 13 and The Anatomy of a Bubble Burst.
⚡ BITCOIN
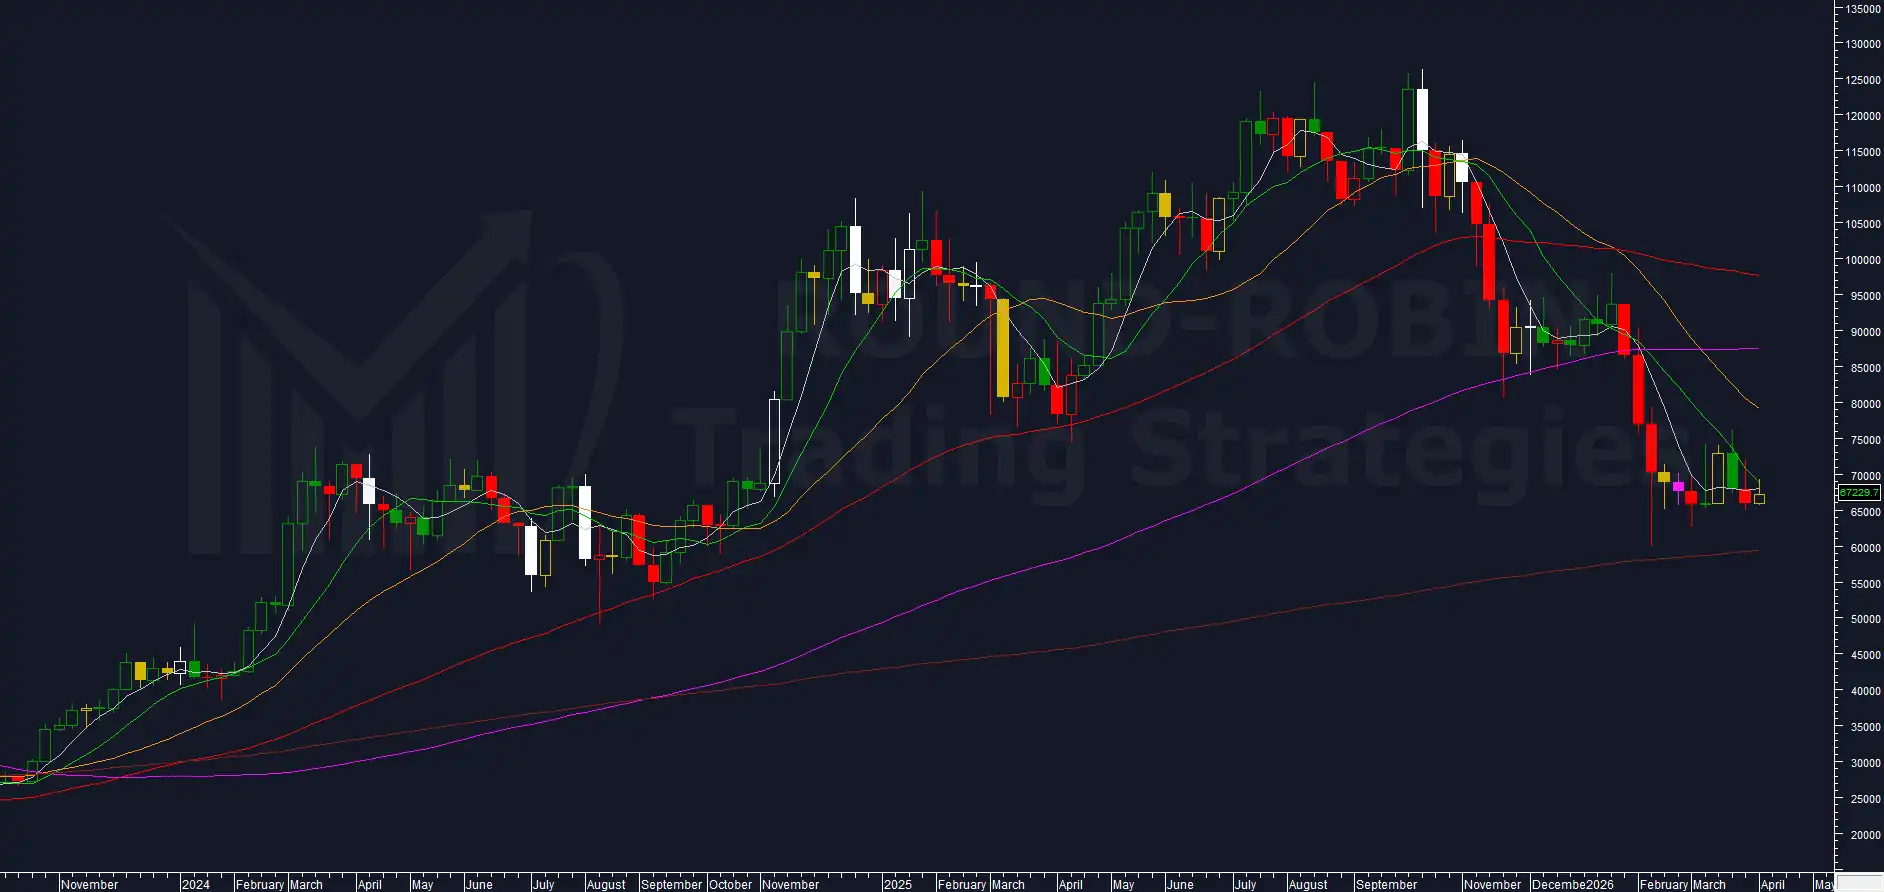
chart: Bitcoin weekly
Nothing new. Our positions remain unchanged. Weekly close at 66,995.15.
Third consecutive week compressed below the MA10W. Fifth consecutive week with essentially the same low. Weekly values remain inside. The MA200W (our target) continues its slow climb below 60K.
The weekly range has dropped significantly to 5.46%. In the most recent cases, range collapses of this nature have led to one final bullish spike before the dump.
For last week’s update and the full breakdown of levels and scenarios, refer to our Charts Flash Week 13 and Bitcoin Chart of the Week.
⚡ S&P 500
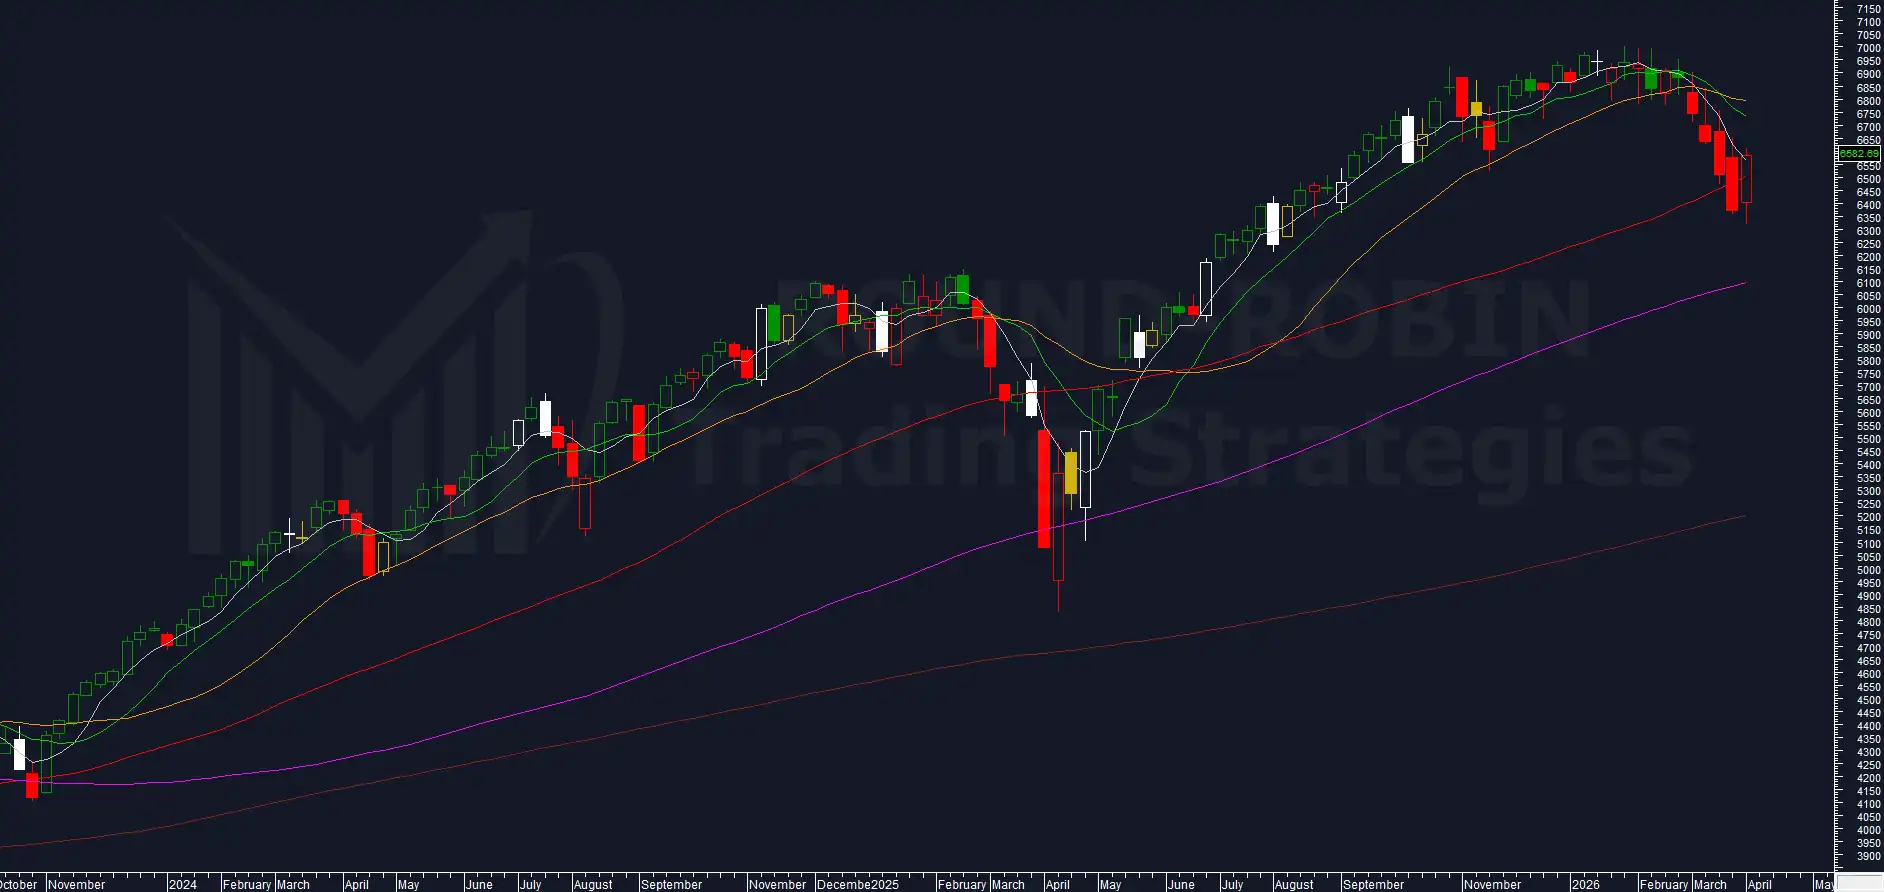
chart: S&P500 weekly
Despite declining highs and lows, our algorithm closes the short positions on loss of momentum. Weekly close at 6,582.69.
The simultaneous recovery of the MA50W and the MA5W is the technical headline of the week. The bullish body is among the most extended in the past year.
It could be just an ephemeral bounce, but it is impossible to ignore all the positive elements that, weighed against the snapshot of this week, clearly outweigh the negatives.
For last week’s update and the full S&P 500 framework, refer to our Charts Flash Week 13, the Chart of the Week Week 11, the February Deep Dive, and the original W02 analysis.
⚡ DAX
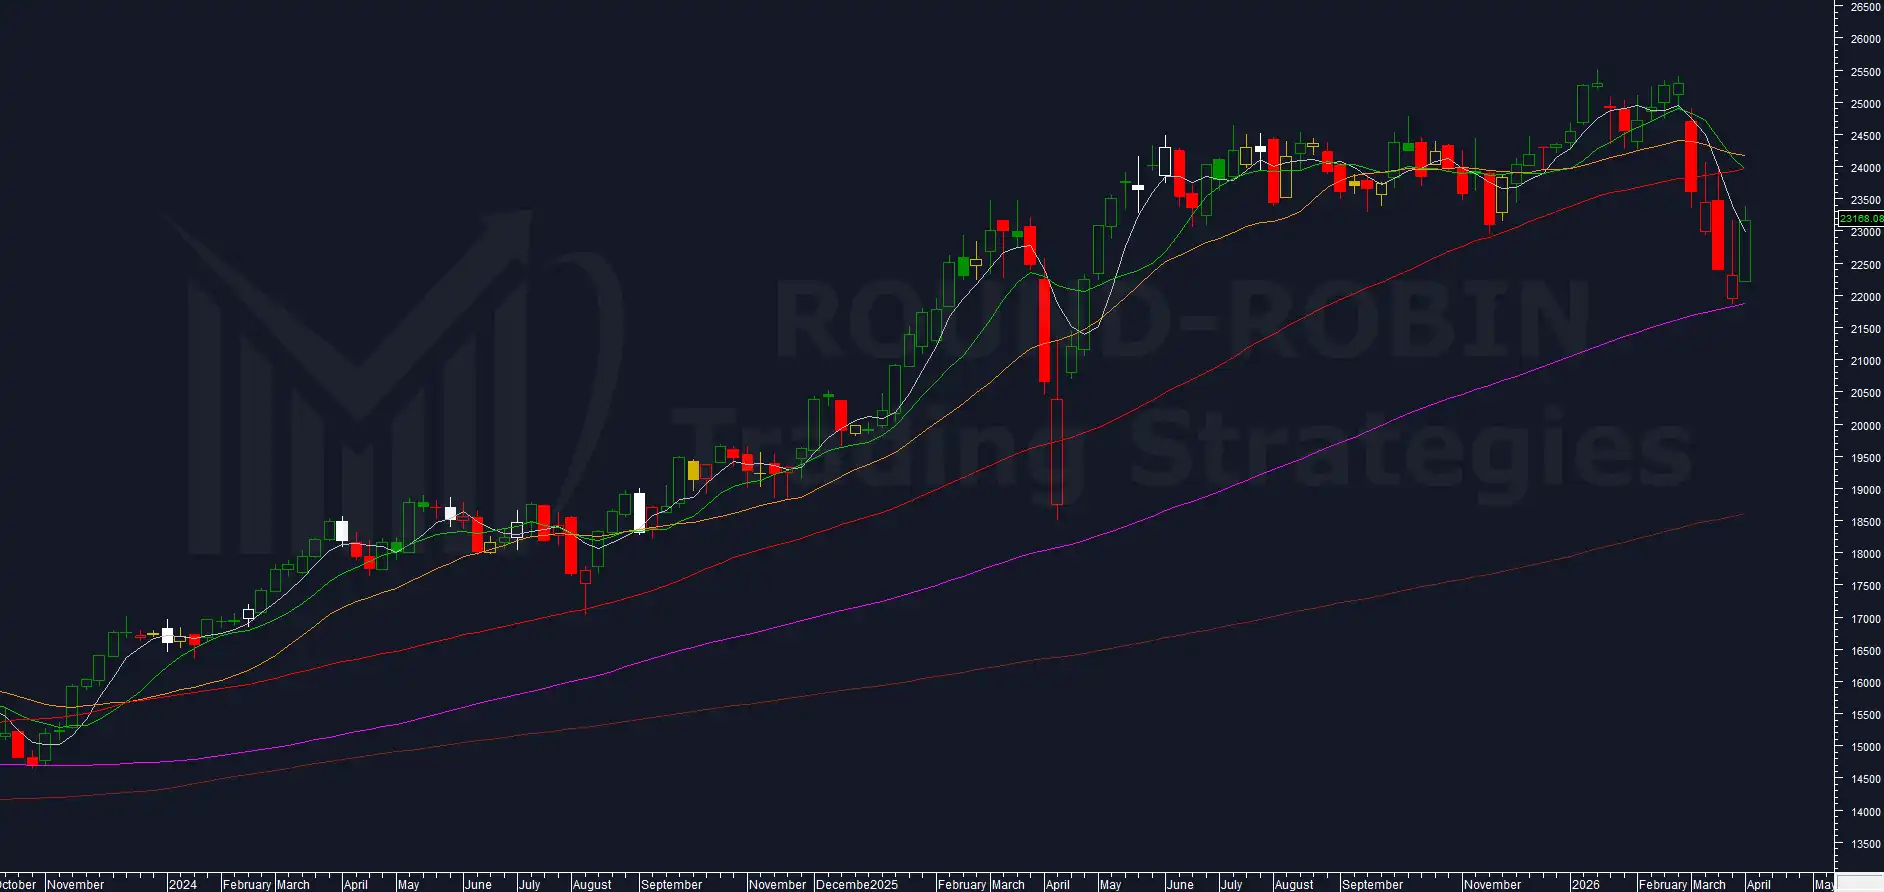
chart: DAX weekly
What looked like a “courageous” call from our algorithm last week has turned out to be the trade that, with its nearly +900 points (+5.9%), allowed the global portfolio to defend itself from Brent volatility and the negativity of the US indices bounce.
Despite the short week, rising highs and lows. Recovery of the MA5W. Weekly close at 23,168.08. The first target outlined last week, a weekly close above the MA5W, has been reached. Prices now sit in the 23,100-23,500 zone where, without further bullish confirmation, the move could exhaust itself. The position remains long.
Leave a Reply